Association Between Soil Lead and Blood Lead - Evidence
Mark Laidlaw, PhD
New York Times Article - 1925
In 1925, The New York Times Published the following words of Dr. Yandell Henderson, Professor of Applied Physiology at Yale University: "The breathing day by day of fine lead dust from automobiles using leaded gasoline will produce chronic lead poisoning on a large scale in the population of cities and would cause vast number of the population to suffer from slow lead poisoning. He stated that "This is probably the greatest single question in the field of public health that has ever faced the American public. Furthermore, he stated that "It is the question whether scientific experts are to be consulted, and the action of the Government guided by their advice; or whether, on the contrary, commercial interests are to be allowed to subordinate every other consideration to that of profit".
Clair Patterson Statement - 1980
Caltech Professor Clair Patterson stated the following in 1980: "Sometime in the near future it probably will be shown that the older urban areas of the United States have been rendered more or less uninhabitable by the millions of tons of poisonous industrial Pb residues that have accumulated in cities during the past century. Extrapolating from present information, probably it will be shown in the future that average American adults experience a variety of significant physiological and intellectual dysfunctions caused by long-term chronic lead insult to their bodies and minds which results from excess exposures to industrial lead that are five hundred-fold above natural levels of lead exposure, and that such dysfunctions on this massive scale may have significantly influenced the course of American history. (NRC, 1980; see p. 265-349). This pivotal and controversial statement of Clair Pattersons provided inspiration for this website.
The three main sources of lead exposure in urban environments are:
1) Soil (from leaded gasoline, exterior lead paint, used lead acid batteries extraction and lead smelters);
2) House Dust (from lead in soil and interior paint particles);
3) Water (from lead water lines, groundwater from migration of lead contaminated soil and naturally occurring sources)
Petrol/Gasoline Lead Emissions in USA - 1920's to 1990
The lead emitted from gasoline (see line in blue) in high traffic inner city areas between the 1920's and 1980's (in the US) was deposited and incorporated within the top 5-10 centimetres of the surrounding soils. We now know that the lead in these soils can become resuspended into the air where it migrates into homes. People and pets also track the lead contaminated soil into homes. Children and adults are then poisoned. This, and in certain cases exposure to flaking lead paint and lead from lead water pipes, has resulted in epidemics of lead poisoning in large parts of some inner-city areas. This is a global phenomenon and will continue until lead in soil dust in urban areas is isolated.
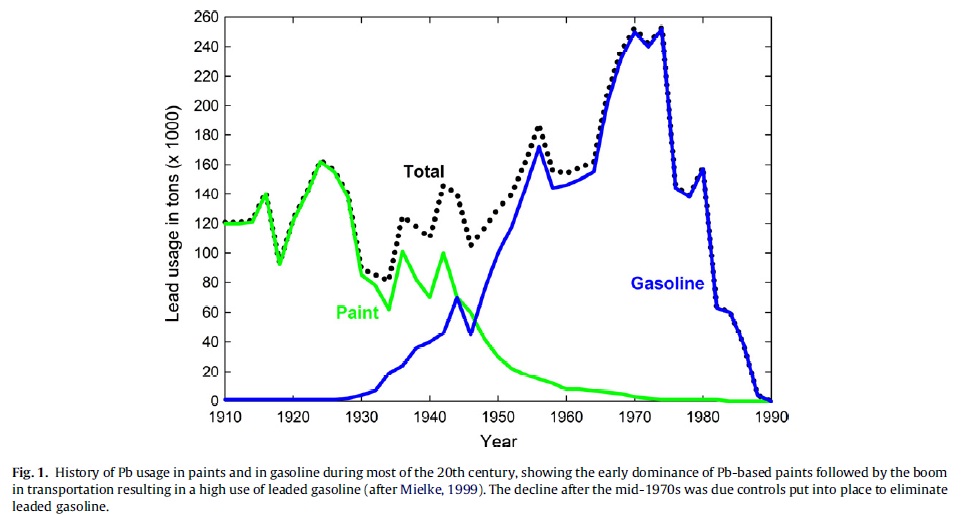
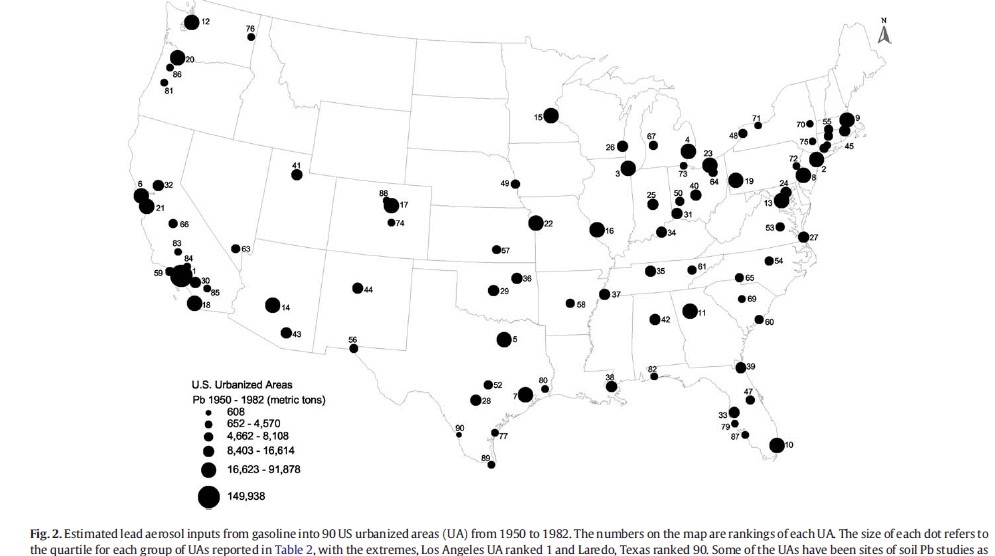
Historical emissions of lead into the atmosphere from past use of lead in gasoline (petrol) between 1950 and 1982 in 90 urban areas of the United States (Mielke et al., 2011)
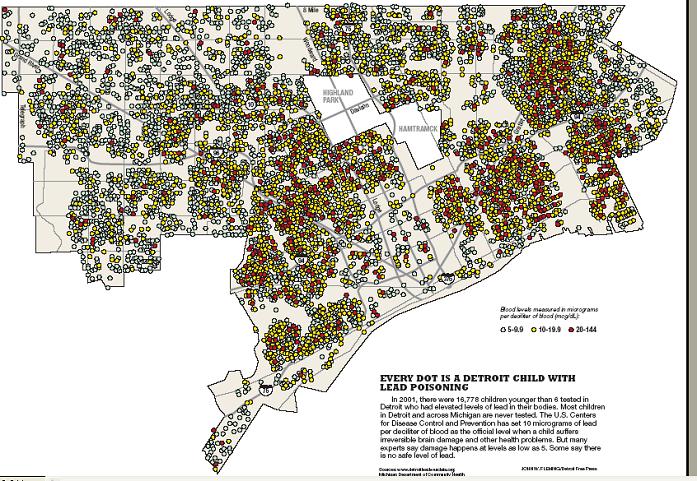
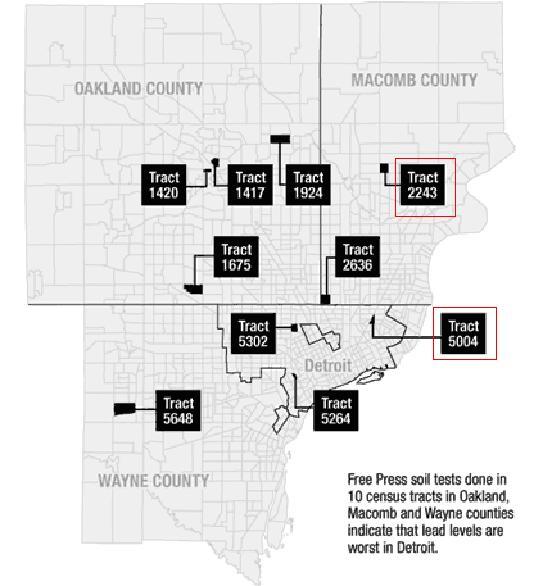
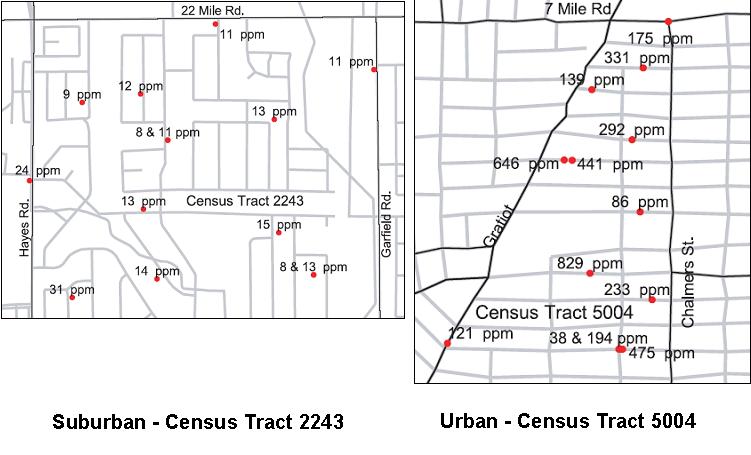
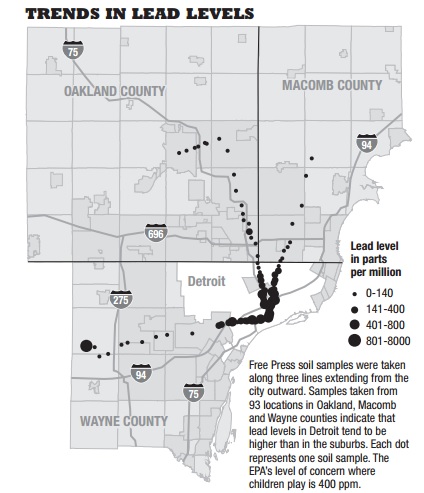
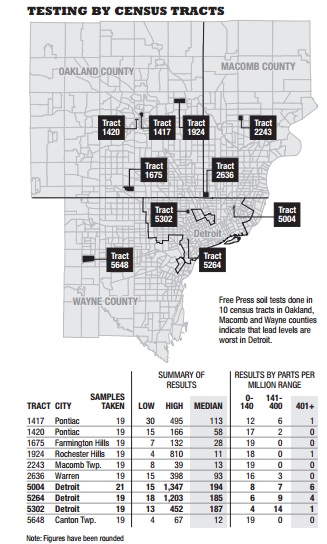
An example of the lead poisoning epidemic - Detroit, Michigan
Note that the cases in this picture likely only represent a portion of the the total number of cases as typically blood lead is drawn from less than the full population.
2001
2012
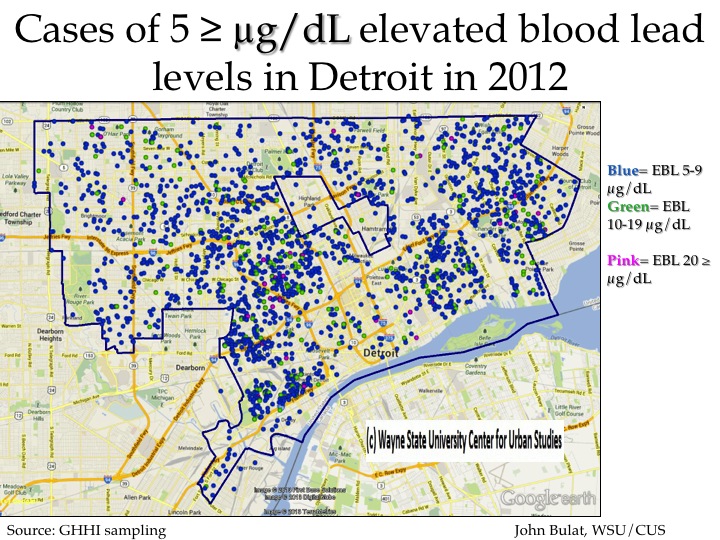
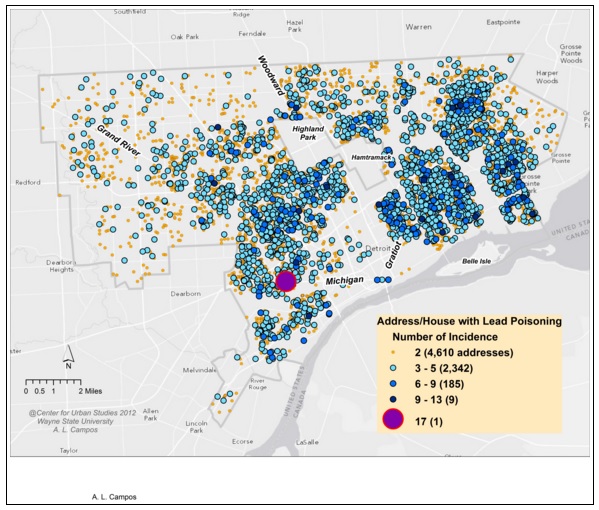
The above map shows the number of lead poisoning incidences per address/home in the City of Detroit in 2012. The yellow dots show that there are 4,610 homes in the city with two occurrences per home; these are the most frequent. However, the blue dots, which show three to five or six to nine occurrences per home, cover more of the map because of the higher number of people affected. There was one home in the southwest portion of the city that had 17 lead poisoning cases, according to the map.
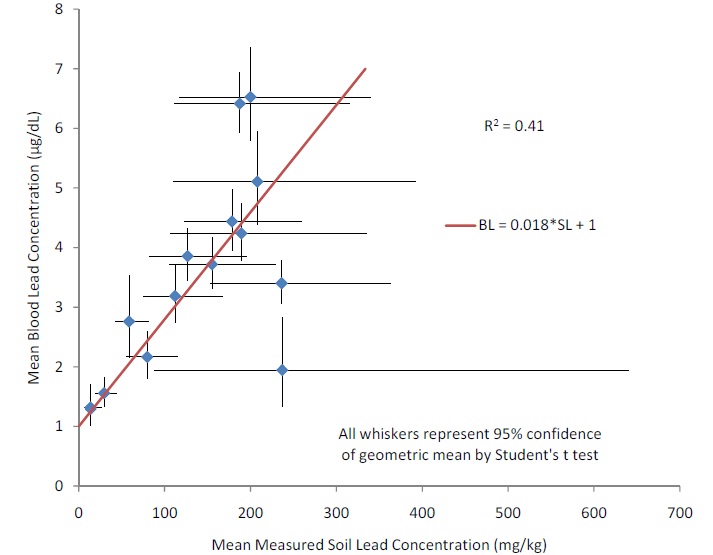
Plot of Soil Lead Versus Children's Blood Lead in Detroit - Bickell 2010
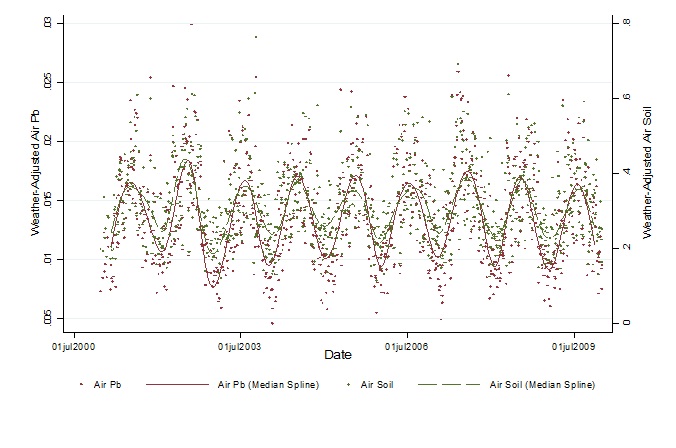
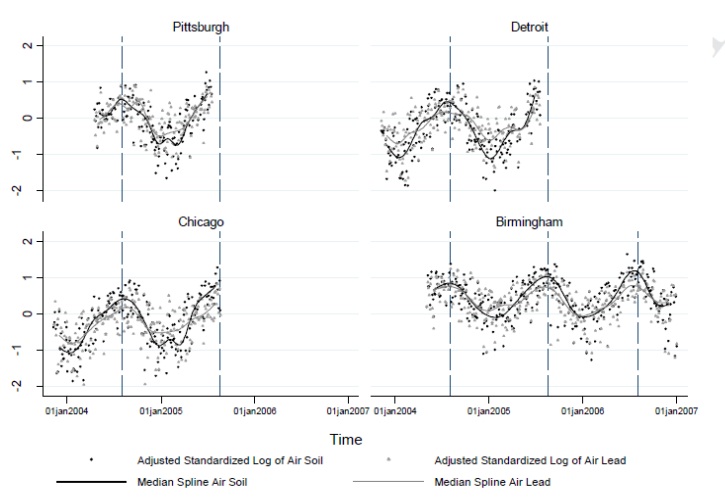
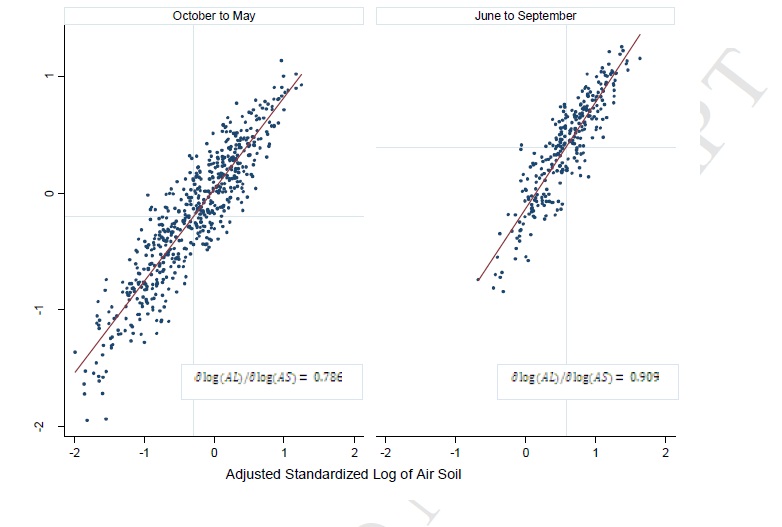
Plot of Temporal Variation in Atmospheric Soil Dust and Lead in Detroit - 2001-2009
This plot shows that soil that has been resuspended into the atmosphere is highly correlated with air lead concentrations. This is important as it indicates that air lead levels are linked with surficial soil lead concentrations. Therefore, reducing air lead concentrations must involve isolation of urban lead contaminated soils
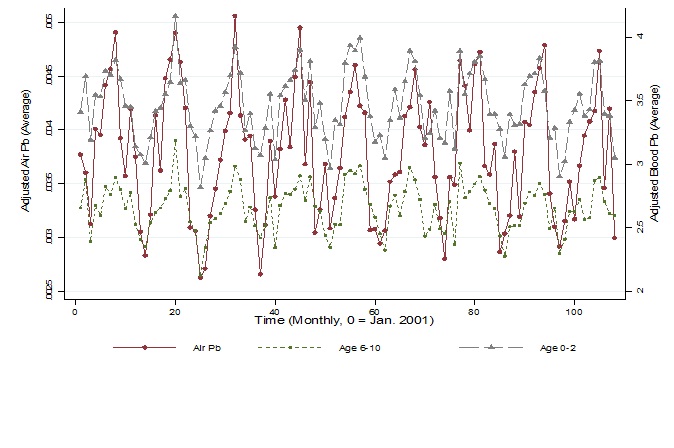
Plot of Temporal Variation in Atmospheric Lead and Children's Blood Lead in Detroit - 2001-2009
This plot shows that children's blood lead levels are highly correlated with atmospheric lead concentrations (which are correlated with atmospheric soil on the previous page). This is important as it is apparent that to reduce children's blood lead levels, soil lead contamination must be isolated. Furthermore, this plot indicates that Pb paint is not thought to be attributable to seasonal variations in children's blood lead levels.
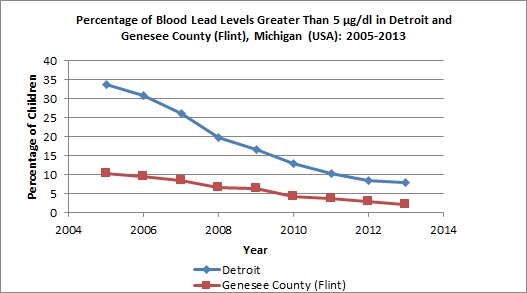
Flint, Michigan (USA) - Blood Lead Situation - 2010-2015
In Flint, Michigan (USA), a public health crisis resulted from the switching of the water supply from treated Lake Huron water to untreated corrosive water sourced from the Flint River in April 2014, which caused lead to leach from water lines exposing a portion of the children in the city. The quarterly blood lead levels of children <6 years old in Flint (as well as in the State of Michigan and Genesee County) were compiled between 2010 and 2015 and the percentage of children with blood lead levels ≥5 g/dL were calculated by the Michigan Department of Environmental Quality (MDEQ). The percentage of children with blood lead levels ≥5 g/dL in the third quarter of 2013 (before the water source switch) rose from about 3.6% to about 7% in JulySeptember) 2014 (see Figure 2 below). This figure clearly shows the seasonal nature of childrens blood lead pattern between 2010 and 2015 with a peak in the third quarter and a trough in the first or second quarter.
The questions that are not being asked is why did childrens blood lead levels display a seasonal blood lead pattern before the introduction of the new water supply in Flint; and what are the implications of these seasonal blood lead patterns? Based on our interpretation of blood lead seasonality in urban areas such as Detroit (located approximately 100 km southeast of Flint), we infer that before the change in water supply the blood lead peaks in the third quarters in Flint were being driven by seasonal resuspension of lead dust from contaminated soils into the atmosphere during dry periods. This lead source may have been compounded by contributions from lead leaching from water pipes during the summer. This longer-term view of lead uptake via blood lead levels indicates that the blood lead peaks in the third quarters of 2014 and 2015 may have been driven by a combination of lead from resuspended soil-derived dust and lead newly released from water lines.
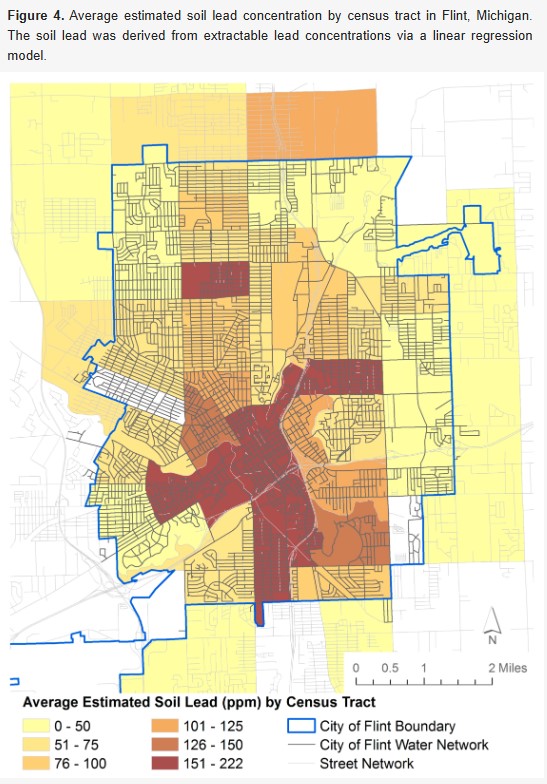
Average estimated soil lead concentration by census tract in Flint, Michigan.
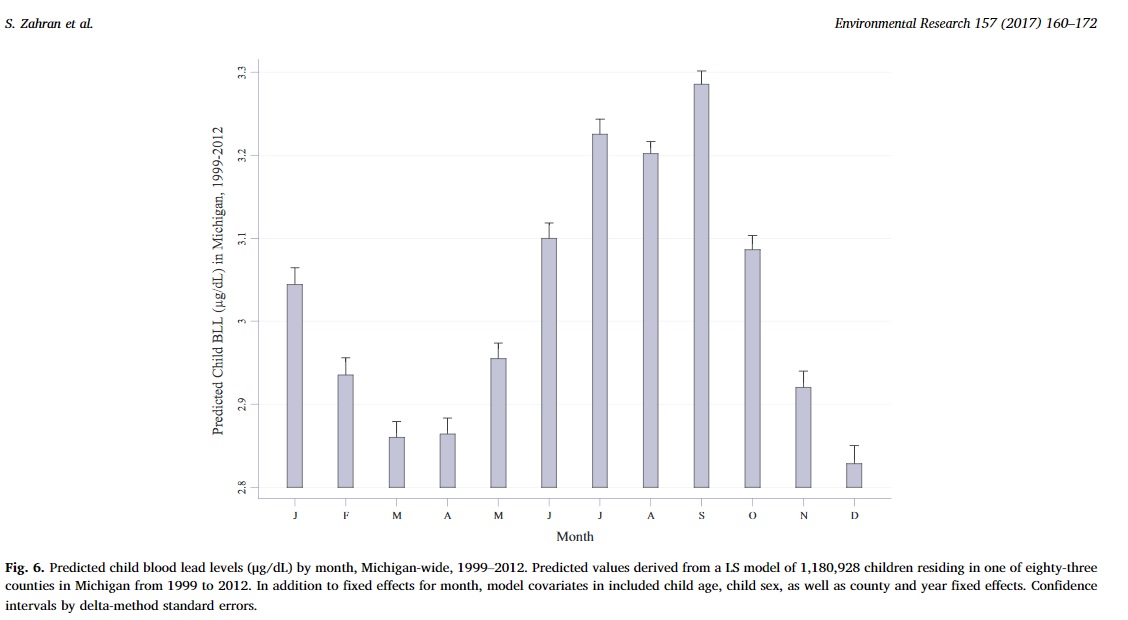
Predicted Children's Blood Lead Seasonality - State of Michigan: 1999-2012
Conceptual Model of Exposure to Exterior Lead in Urban Areas
Blood Lead Prevalence in USA - (somewhat dated)
In many urban inner-city areas of the United States, there is an epidemic of childhood blood lead poisoning (Gould, 2009). It has been estimated that 24.5%, or 9.6 million U.S. children have a blood lead in the range of 2 to 10 micrograms per decilitre, a level which will cause sub-clinical signs (Gould, 2009). The National Health and Nutrition Examination Survey (NHANES) III 1999-2002 database indicates that approximately 2.4 million children have blood Pb levels between 5 and 9.9 microgram/deciliter (Iqbal et al., 2008) and that within that population of 1-'5-year olds with blood Pb levels of 5 microgram/deciliter or higher, the prevalence was 47% for non-Hispanic Black children, 28% for Mexican American children, and 19% for non-Hispanic White children (Bernard and McGeehin, 2003). The fact that children of color are nearly 4 times more likely than white children to have blood Pb levels between 5 and 10 microgram/deciliter (and 13 times more likely to have blood Pb levels above 20 microgram/deciliter) (Bernard and McGeehin, 2003) raises concerns about social justice and the long-term health of these children. In addition, in 2004, in 10 ABLES states, a total of 10,527 females aged 16--44 years were tested, and all BLLs for this group were reported. Of the number tested, 1,370 (13.0%) had BLLs >5 g/dL (10.9 per 100,000 female residents aged 16--44 years). I have not located the breakdown by race or by urban versus suburban area yet.
Childhood lead poisoning is a major environmental justice issue.
Why it is Important to Understand Exposure to Lead in Soil Dust
Childhood lead poisoning (Zahran et al., 2013a), (Zahran et al., 2013b) and preeclampsia/eclampsia (Zahran et al., 2014)(Poropat, Laidlaw et al., 2017)(Zhong et al., 2022)(Vigeh et al., 2025)(Laidlaw, 2026) have been shown to be associated with lead in soil and dust. Past petrol lead emissions in Australia have been associated with motor Neurone Disease. (Laidlaw, 2026)
1) Childhood lead poisoning is one of the most common pediatric health problems in the United States today (CDC)
2) Preeclampsia is the leading cause of maternal death worldwide and a major cause of preterm delivery and is associated with soil lead exposure. (WHO, 2025)
3) Lead has been associated with autism.(Ogunesan et al., 2026)
4) One in Four US Households Likely Exceed New Soil Lead Guidelines (200 mg/kg) - Link to Source - Filippelli et al, 2024
Various Health Outcomes at Low Blood Lead Levels (<10 ug/dL)
Low PbB levels (<10 ug/dL) typically associated with urban soil Pb exposure are associated with a myriad of health outcomes. Low PbB levels (<10 ug/dL) are associated with Attention-Deficit Hyperactivity Disorder (ADHD)(Nigg et al., 2010), a reduction in childrens tests scores for reading (odds ratio = 0.51, p = 0.006) (Chandramouli et al., 2009), writing (odds ratio = 0.49, p = 0.003) (Chandramouli et al., 2009; Miranda et al., 2007) and mathematics (Miranda et al., 2007). Canfield et al. (2003) observed that when lifetime average PbB concentrations in children increased from 1 to 10 mg/dL, the intelligence quotient (IQ) declined by 7.4 points. Jusko et al. (2008) observed that compared with children who had lifetime average PbB concentrations < 5 mg/ dL, children with lifetime average concentrations between 5 and 9.9 mg/dL scored 4.9 points lower on Full-Scale IQ (91.3 vs. 86.4, p = 0.03). Similarly, Surkan et al. (2007) observed that children with 5-10 mg/dL had 5.0 (S.D. 2.3) points lower IQ scores compared to children with PbB levels of 1-2 mg/dL (p = 0.03). Interestingly, multiple studies have shown that that the strongest Pb effects on IQ occurred within the the first few micrograms of PbB (Schnaas et al., 2006; Canfield et al., 2003; Lanphear et al., 2005). Low PbB levels (<10 ug/dL) have also been associated with various physiological outcomes such as kidney damage (Fadrowski et al., 2010), dental caries (Moss et al., 1999), puberty delay in boys (Williams et al., 2010) and girls (Selevan et al., 2003) and cardiovascular outcomes in adults (Navas-Acien et al., 2007).
For a recent review of the health effects of lead exposure, see Bellinger, 2011. Another good article to read is titled Epigenetics of early-life lead exposure and effects on brain development by Senut et al. (2012).
Environmental Protection Agency (EPA). Integrated Science Assessment (ISA) for Lead. Washington, DC: EPA; 2024.
Evidence of Health Effects Associated With Low Level Lead Exposure - National Toxicology Program, 2012
Link to United States National Toxicology Program Monograph on Health Effects of Low-level Lead (June 2012)| System Affected | Population | NTP Conclusion | Principal Health Effects | Blood Lead ( g/dL) |
| Neurological | Adult | Sufficient | Increased incidence of essential tremor | Yes, < 10 |
| Limited | Psychiatric effects, decreased hearing, decreased cognitive function, increased incidence of amyotrophic lateral sclerosis | Yes, < 10 | ||
| Limited | Increased incidence of essential tremor | Yes, < 5 | ||
| Children | Sufficient | Decreased academic achievement, intelligence quotient, and specific cognitive measures; increased incidence of attention-related behaviours and problem behaviours | Yes, < 5 | |
| Sufficient | decreased hearing | Yes, < 10 | ||
| Immune | Adult | Inadequate | - | Unclear |
| Children | Limited | Increased hypersensitivity/allergy by skin prick test to allergens and increased immunoglobulin* (not a health outcome) | Yes, < 10 | |
| Inadequate | Asthma, eczema | Unclear | ||
| Cardiovascular | Adults | Sufficient | Increased blood pressure and increased risk of hypertension | Yes, < 10 |
| Limited | Increased cardiovascular-related mortality and electrocardiography abnormalities | Yes, < 10 | ||
| Children | Inadequate | Increased cardiovascular-related mortality and electrocardiography abnormalities | Unclear | |
| Renal | Adults | Sufficient | Decreased glomerular filtration rate | Yes, < 5 |
| Children ≥12 years old | Inadequate | Decreased glomerular filtration rate | Unclear | |
| Children <12 years of age | Limited | Decreased glomerular filtration rate | Yes, < 5 | |
| Reproductive and development | Adult | Sufficient | Women: reduced fetal growth | Yes, < 5 |
| Men: adverse changes in sperm parameters and increased time to pregnancy | Yes, ≥ 15-20 | |||
| Limited | Women: increase in spontaneous abortion and preterm birth | Yes, < 10 | ||
| Men: decreased fertility | Yes, ≥ 10 | |||
| Men: spontaneous abortion in partner | Yes, ≥31 | |||
| Inadequate | Women and men: stillbirth, endocrine effects, birth defects | Unclear | ||
| Children | Sufficient | Delayed puberty, reduced postnatal growth | Yes, < 10 | |
| Limited | Delayed puberty | Yes <5 |
Google Scholar Search Results For "Lead Poisoning" and Multiple Health Outcomes:
Amyotrophic lateral sclerosis (ALS)
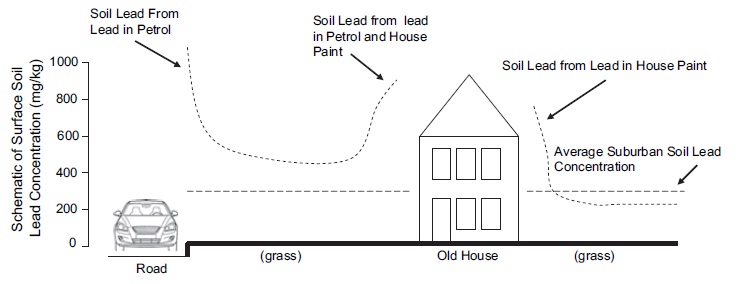
Typical Pattern of Roadside Lead in Soil Found In Urban Cities
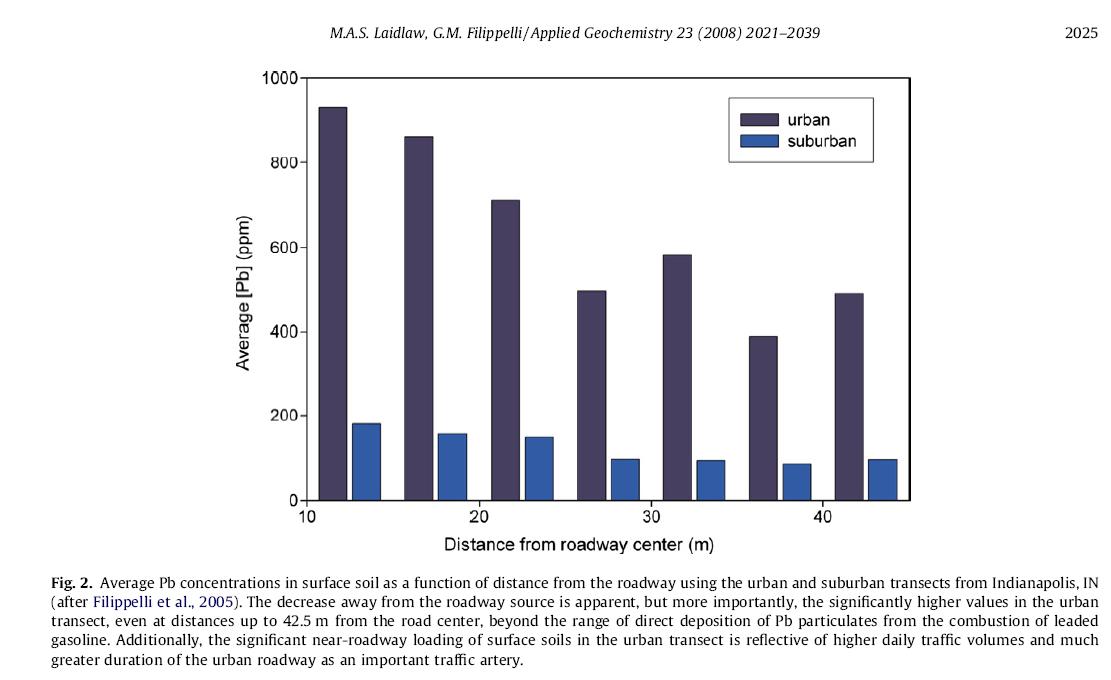 Robin Raftis of IUPUI actually completed the work for this transect.
Typical Pattern of Houseside Lead in Soil Found In Homes With Old Exterior lead Based Paint in Boston, Massachusetts
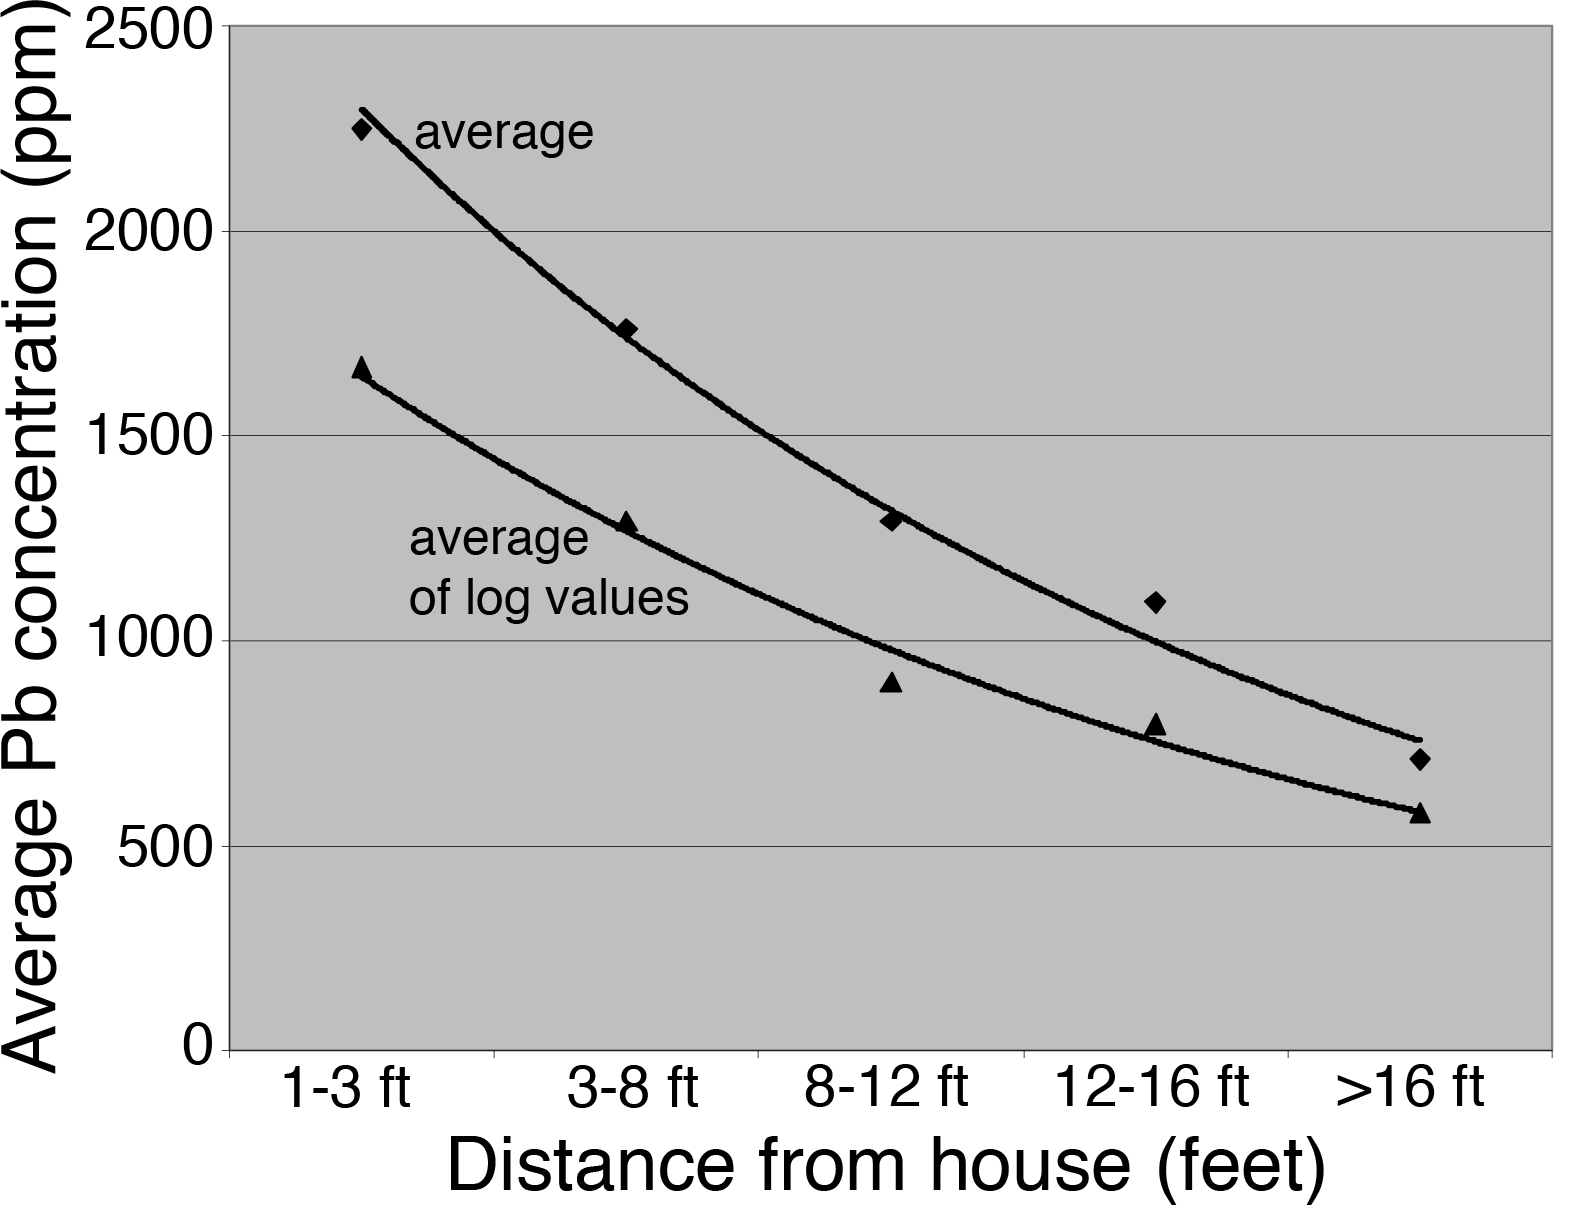 Yardside Lead in Soil (Boston)
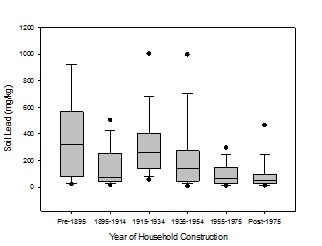
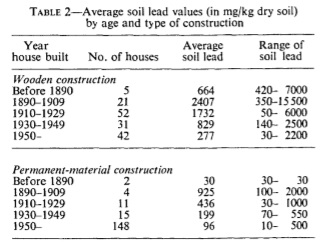
Box Plots of Soil Lead Concentrations in Residential Vegetable Gardens of Melbourne Australia Arranged by Year of Household Construction
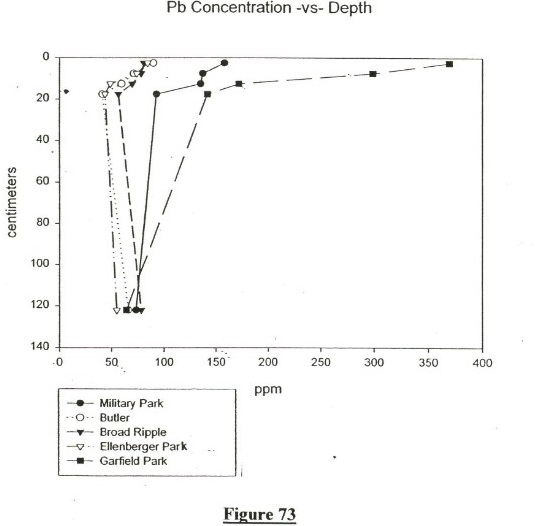
Soil Lead Concentration -vs- Depth (0-120cm) - Marion County, Indiana (Laidlaw, 2001)
Urban Soil Lead Comes from Four Main Sources
1. Emissions from Past Use of Lead in Gasoline
2. Exterior Lead Paint
3. Used Lead Acid Batteries Extraction
4. Lead Smelters & Industry
The Emerging Paradigm About The Cause of Urban Lead Poisoning
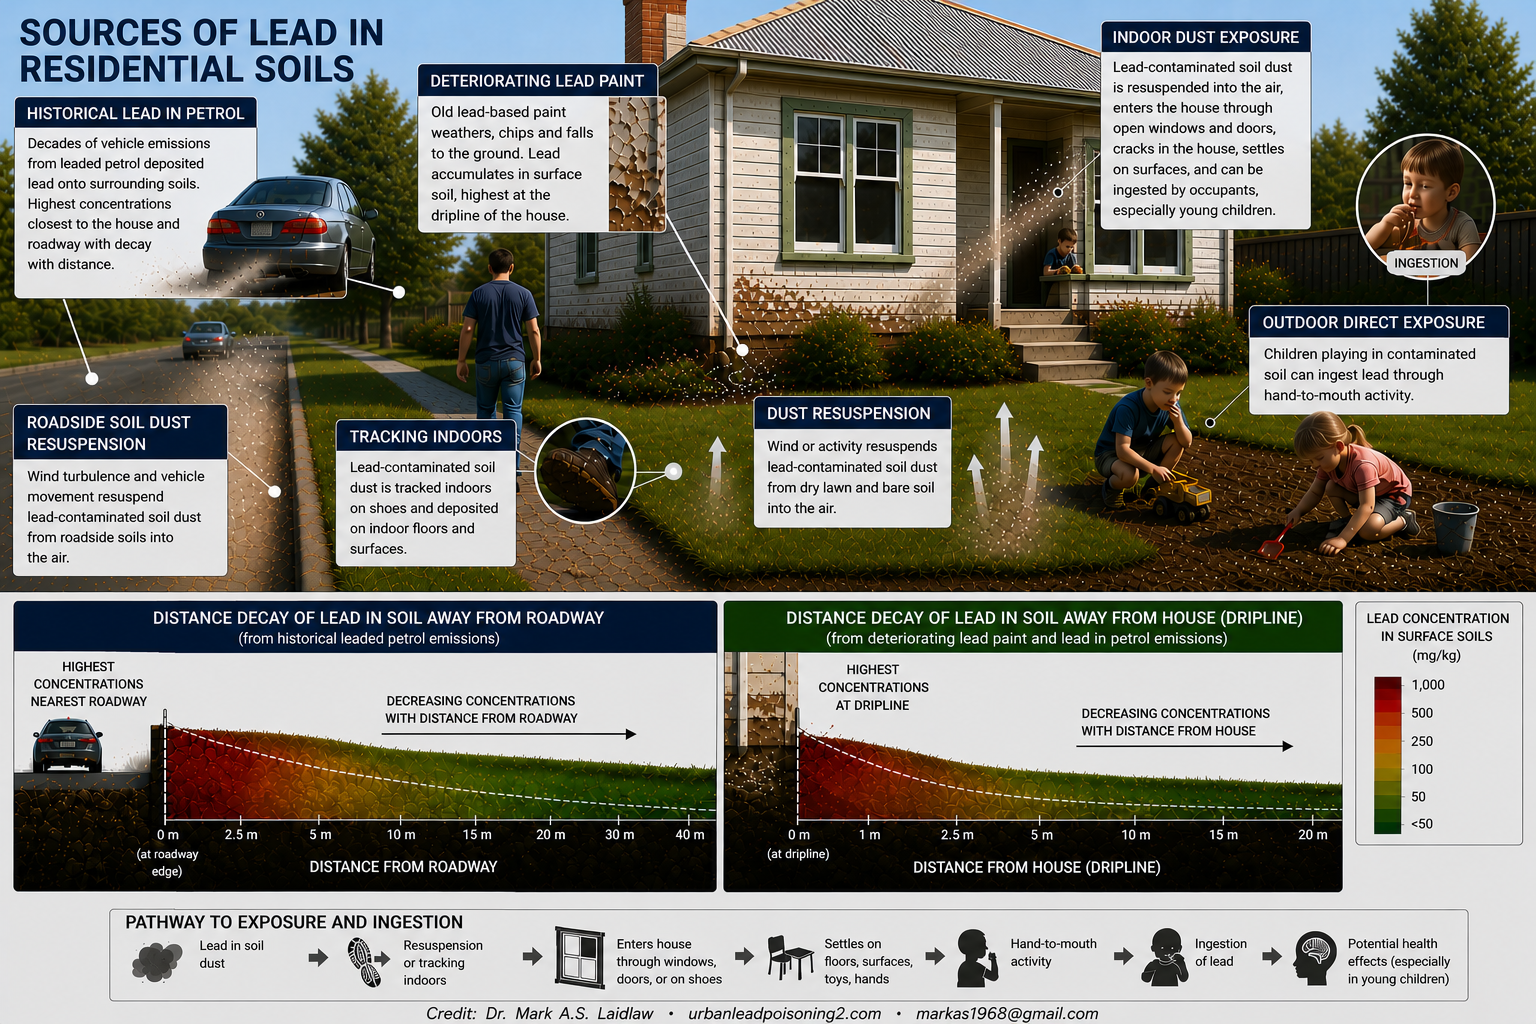
The emerging lead poisoning paradigm is that chronic urban lead poisoning is caused by exposure to lead contaminated soil (contaminated from past leaded gasoline emissions and exterior lead paint) that is tracked into the interior of homes by shoes (Hunt et al., 2006) and the feet and fur of family pets and exterior urban soil that is re-suspended into the atmosphere where it penetrates interiors of homes and settles on interior contact surfaces (Layton and Beamer, 2009)(Laidlaw and Filippelli, 2008). Children are also exposed to lead via direct ingestion of soil outdoors. Chronic urban lead poisoning can also be caused by exposure to interior lead paint dust particles during renovation of older homes and flaking of interior lead paint dust particles and lead leaching into tap water from old lead pipes and from lead in groundwater where lead is naturally enriched or the surface soils are grossly contaminated with lead. Sometimes, children are exposed to lead originating from BOTH lead paint particles AND from exterior lead contaminated soil dust AND lead in water from lead pipes. Children are primarily exposed via hand to mouth activity (thumb sucking) or inhalation on lead in resuspended soil dust. Acute lead poisoning is probably caused by ingestion of interior or exterior lead paint chips.
Relationship Between Exterior Soil Lead and Interior House Dust Lead Concentrations - Sydney, Australia
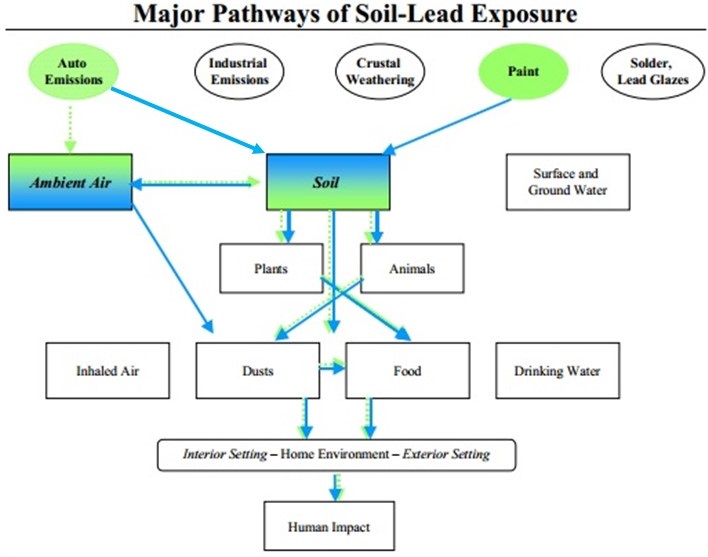
Several Major Pathways of Pb Exposure
Safe Yards: Improving Urban Health through Lead-Safe Yards (Litt et al., 2002)
Boston - Bivariate correlations among environmental measures and childs blood lead
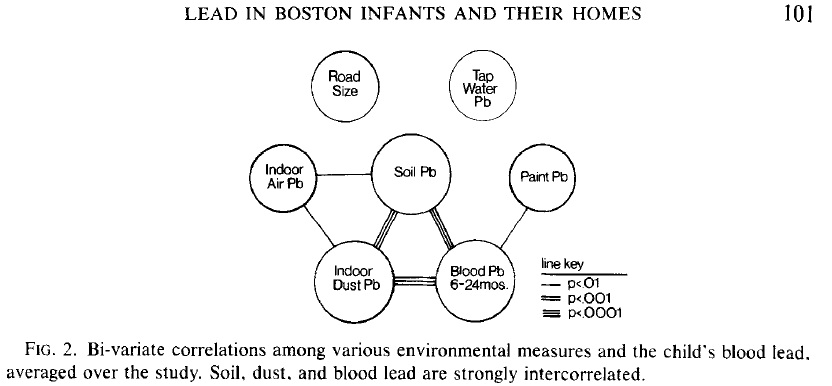
Source - Rabinowitz et al
Study of lead in house dust, interior and exterior paint and soil in 575 homes in Los Angele and Sacramento, California (Sutton et al., 1995)
In a study of 575 homes in Sacramento, California (USA) Sutton et al. (1995) stated the following: Continuous variables measured in this survey expected to influence lead levels in house dust include age of housing, lead levels in interior and exterior paint and soil and paint deterioration. Spearman correlation coefficients for lead dust concentration levels and age of housing, interior paint, exterior paint and soil were -0.34, 0.19, 0.29 and 0.35, respectively (p < 0.01 for each). These variables had little ability to explain dust lead loading levels measured. Spearman correlation coefficients for dust lead loading and age of housing, lead levels in interior paint, and soil were -0.20, 0.12, 0.15, and 0.18, respectively (p <0.02). Among these four variables, interior paint lead levels had the weakest association with lead levels measured in dust (ppm or micrograms per meter squared). Interior paint condition was not associated with dust lead levels. There was a statistically significant but small relationship between exterior paint condition and lead dust concentration levels in Sacramento (Spearmen correlation coefficient r = 0.16, p = 0.03) and dust lead loading in Los Angeles (Spearmen correlation coefficient r = 0.015, p = 0.02). Households in Los Angeles reporting interior paint changes in the past year had geometric mean dust lead loading levels twice as high as in households not reporting paint changes ( 47 micrograms per meter squared compared to 23 micrograms per meters squared). No correlation between lead concentration and interior paint changes was demonstrated in either of the two communities tested.
Migration Pathways of Contaminated Soil and Airborne Particulates to Indoor Dust
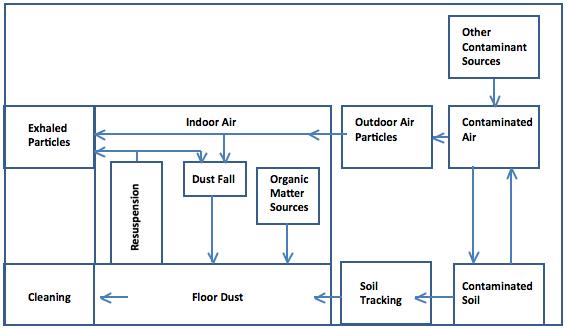
Source - Layton and Beamer
A Large Portion of House Dust Is Composed of Soil
| Investigator | % House Dust From Soil |
|---|---|
| Hawley (1985) | 80 |
| Thornton et al. (1985) | 20 |
| Camann and Harding (1989) | 50 |
| Fergusson and Kim (1991) | 30-50 |
| Calabrese and Stanek (1992) | 20-78 |
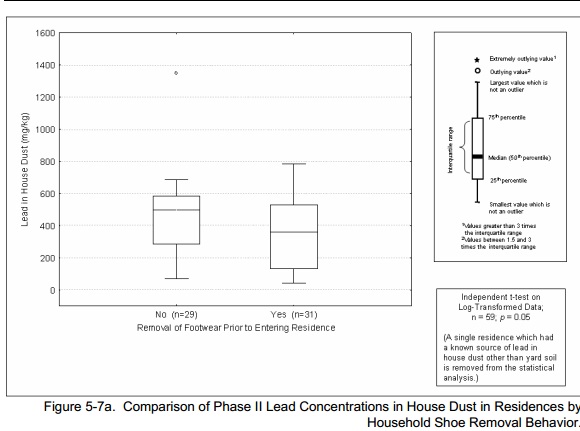
Effectiveness of Shoe Removal Impact on Soil Lead Concentrations Inside Homes
This figure suggests that the simple act of residents removing their shoes before entering their homes can have a major impact on the soil lead concentrations inside homes. Another of the many lines of evidence that lead in soil contributes to indoor lead exposure.
In the maps of soil lead concentration below, note that the California residential soil lead guideline is 80 mg/kg
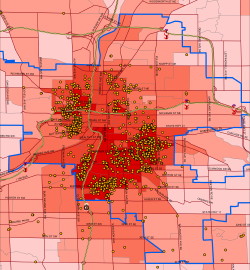
LinkNew Orleans, Louisiana (USA)
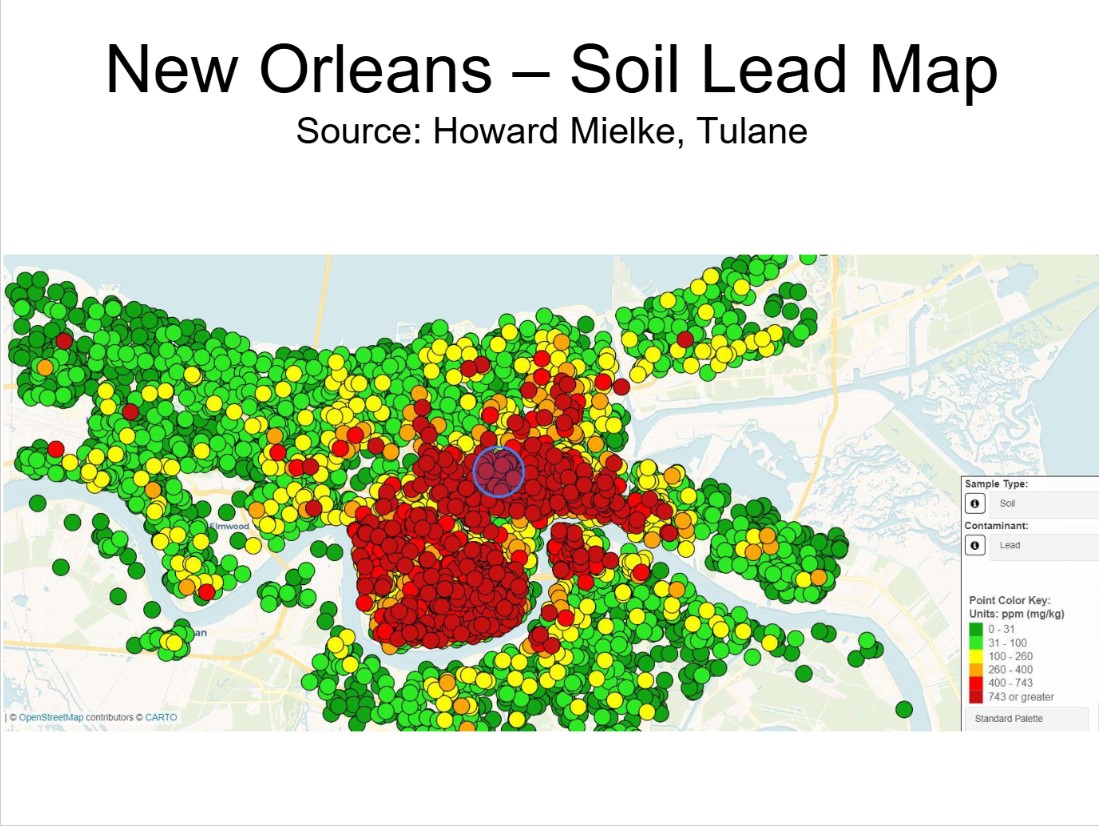
This chart shows that the inner city soils of New Orleans are highly contaminated with lead. This bullseye pattern is typical of large cities that used lead in gasoline for many years. Unfortunately, the residents of many inner-city areas in the US are African American and Hispanic.
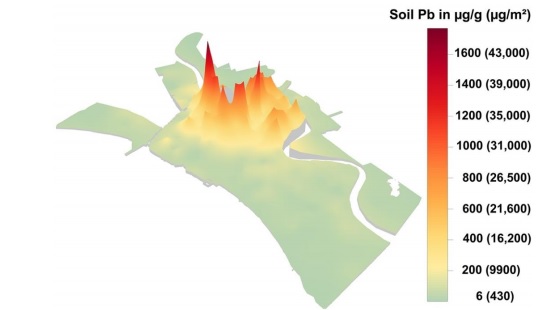
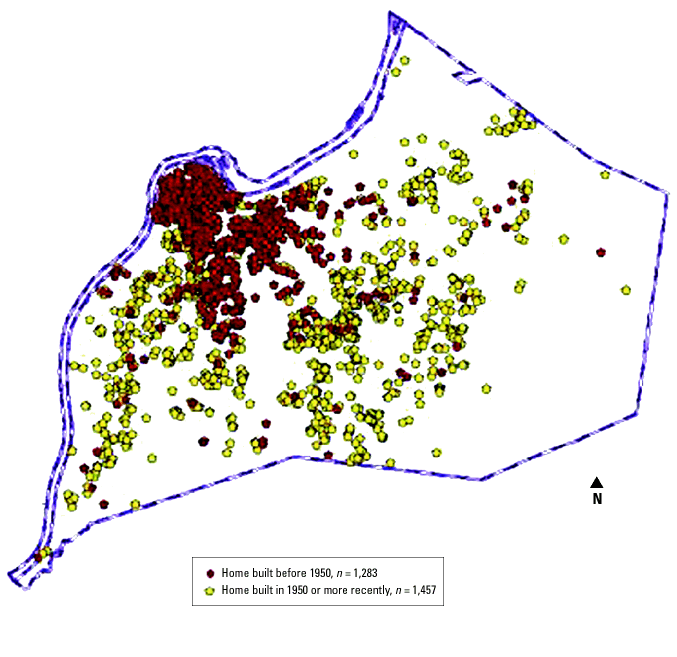
Soil Pb content and corresponding soil Pb loading of the communities of New Orleans
The figure below is particularly important because it shows the soil Pb content along with the corresponding soil Pb loading of the communities of New Orleans. The map illustrates the difference between common measurements of soil Pb and the quantities of Pb on the soil surface that children are likely to encounter during outdoor play activities. The new 2024 USEPA clearance standard for dust Pb loading on interior floors is ~108 g/m2 (10 micrograms per square foot for floors)
New Orleans Soil Pb Blood Pb Relationship At Various Soil Pb Guidelines Levels Using Mielke's Empirical Dataset
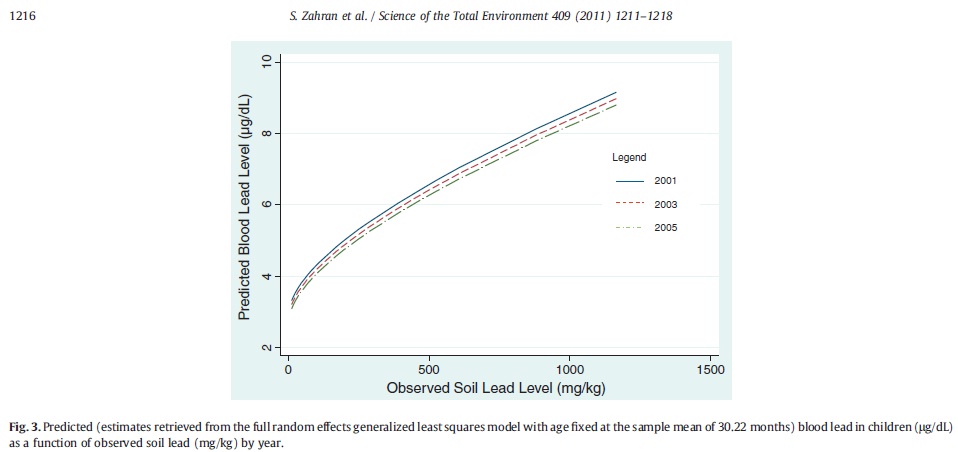
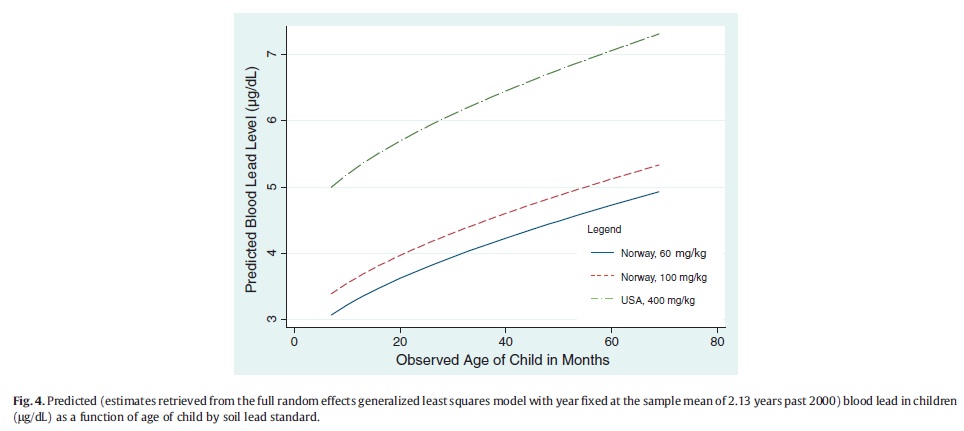
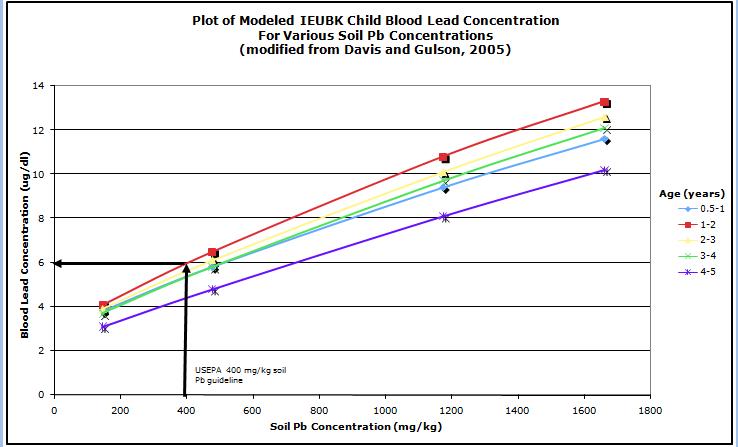
The USEPA's new soil Pb residential guideline is 200 mg/kg, or 100 mg/kg if there is also exposure from lead in water (USEPA, 2024). The first chart shows that as soil lead levels increase, children's blood lead levels increase. The second chart (below) indicates the blood lead response of children's blood lead of childrens age in months to the USEPA's old soil lead guideline of 400 mg/g as well as Norways soil lead guideline of 100 mg/kg. In essence, based upon the current CDC reference level and the empirical soil lead blood blood lead relationship, this chart shows that the 400 mg/kg guideline is inadequate and that it would be appropriate to adopt the Norwegian guideline In the maps of soil lead concentration below, note that the California residential soil lead guideline is 80 mg/kg. This has major implications given the large regions in urban areas exceeding 80 mg/kg.
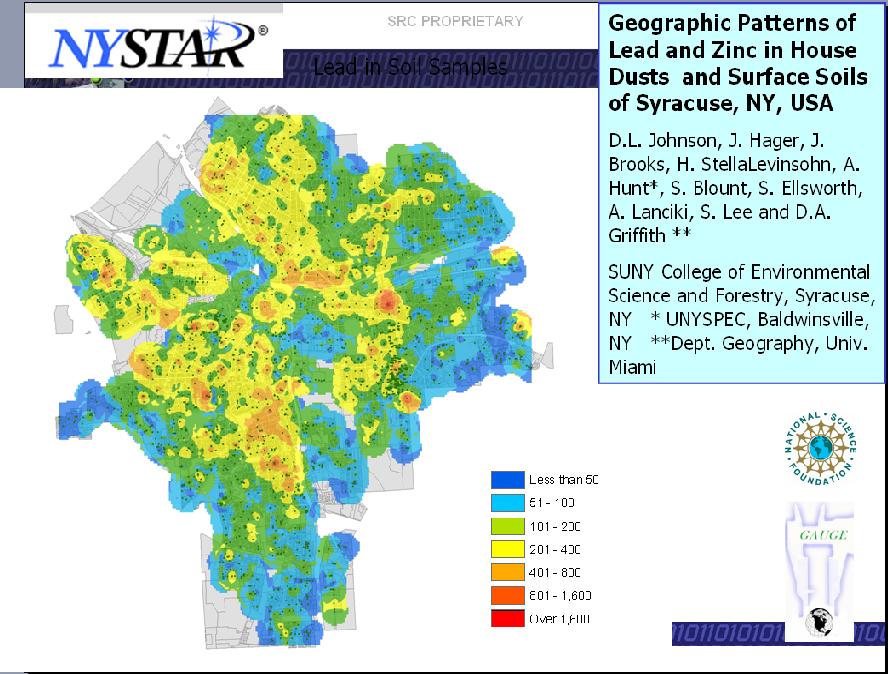
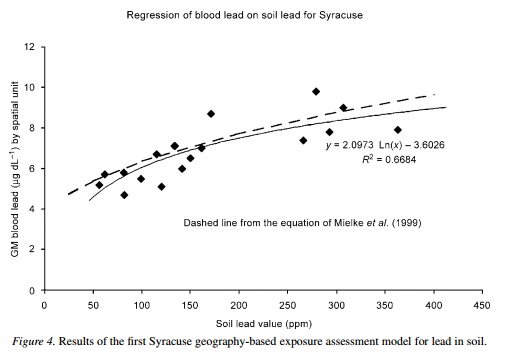
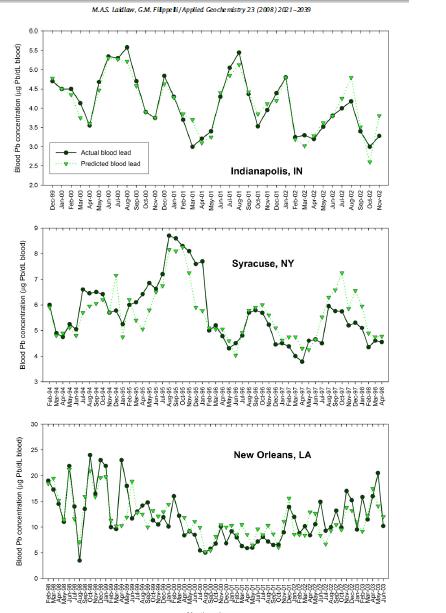
Syracuse, New York
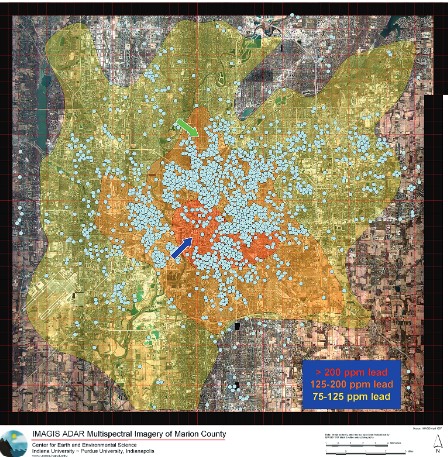
Indianapolis, Indiana (USA)
Points represent blood lead poisoning cases (>10 ug/dl) between 1992 and 1994
Based upon a sample of only 8% of children
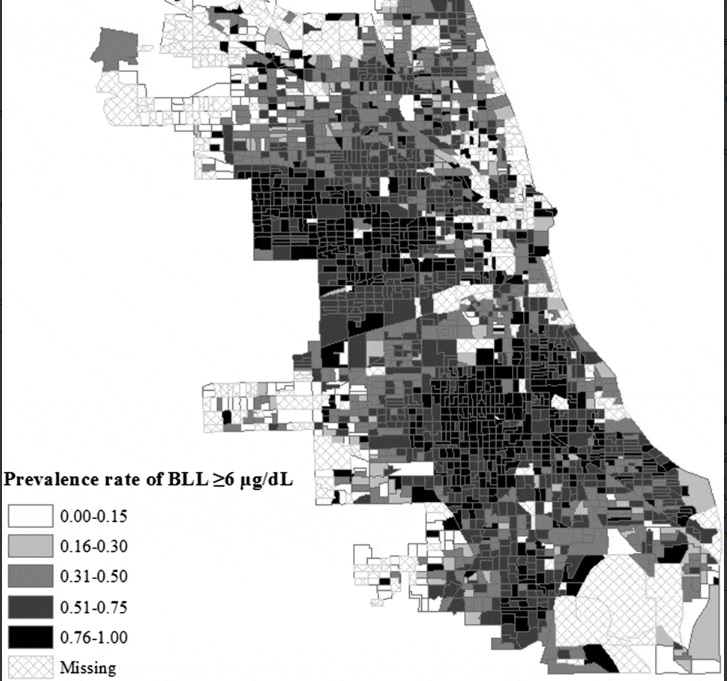
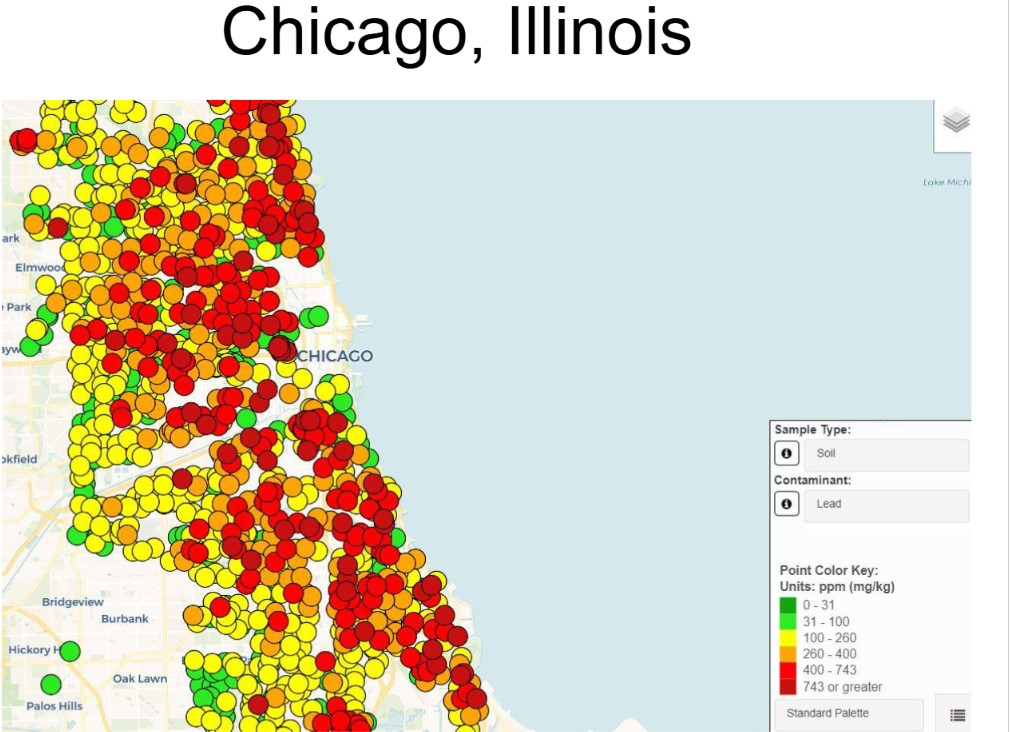
Chicago, Illinois
Unfortunately, the African-American and Hispanic populations have the highest exposure in Chicago. This situation appears to be happening in many of the major inner-cities of the USA. The exposure results from a combination of lead in soil dust, flaking lead paint dust and lead water lines. The absence of any efforts to investigate, remediate or educate the public regarding the lead in dust soil exposure pathway in areas predominantly comprised predominantly of African Americans and Hispanics brings some to question whether environmental racism is occurring. Some people ask the question whether urgent action would have occured if this situation was present in white suburban areas.
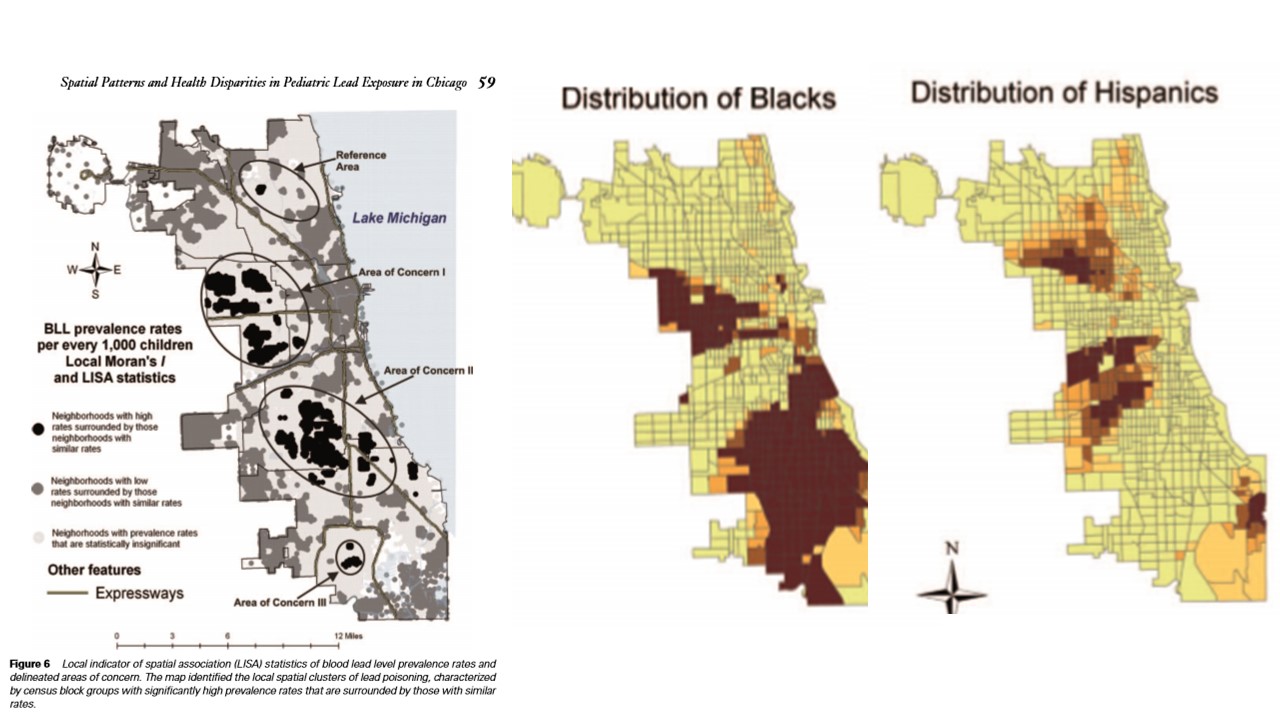
Source - The Racial Ecology Of Lead Poisoning (Simpson and Winter, 2016)
Lead Content of Soils Along Chicago's Eisenhower and Loop-Terminal Expressways
Link to separate United States Geological Survey (USGS) Soil Lead Study of Chicago
Gasoline Pb in soil of Chicago Play Areas (Argonne National Laboratory, 1986)
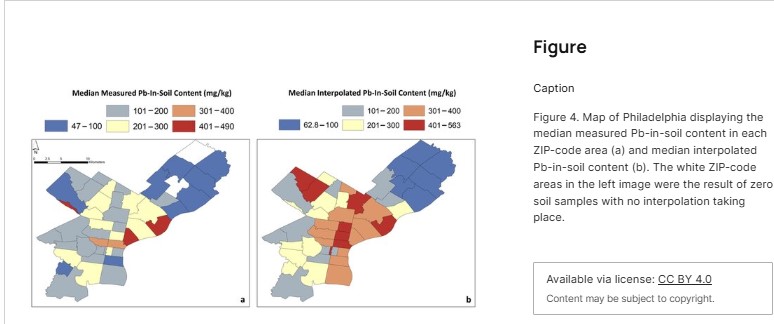
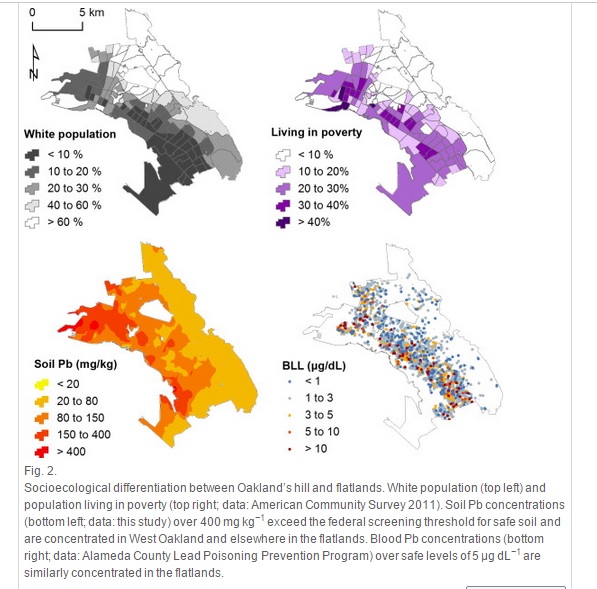
Oakland, California
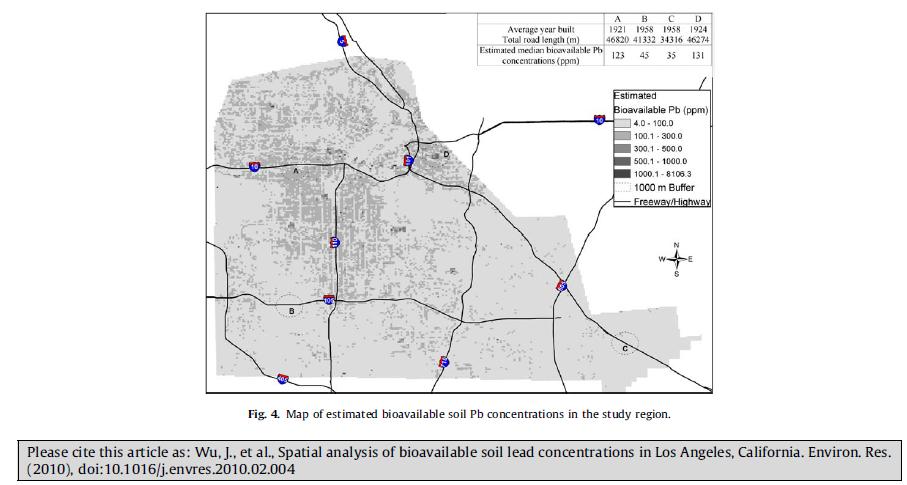
Los Angeles, California
Quote from the conclusion of this paper (Wu et al., 2010): "This study found that areas occupied by majority (population ratio larger than 50%) African American and Hispanic populations have higher soil lead concentrations than Non-Hispanic Whites (data not shown). This finding implies that minority groups in the study area have a higher potential for exposure to lead from soils. Considering the higher birth rates in minority populations, especially people of Hispanic descent, it is likely that lead from soils plays a greater role in childhood blood lead poisoning in children who live in these areas". Note that the soil lead concentrations on this map represent the bioavailable portion of the soil which is easily transferred to the bloodstream when ingested or inhaled. The total concentration for these calculations, which are presented on all the other maps on this site, have much higher concentrations.
Sacramento, California
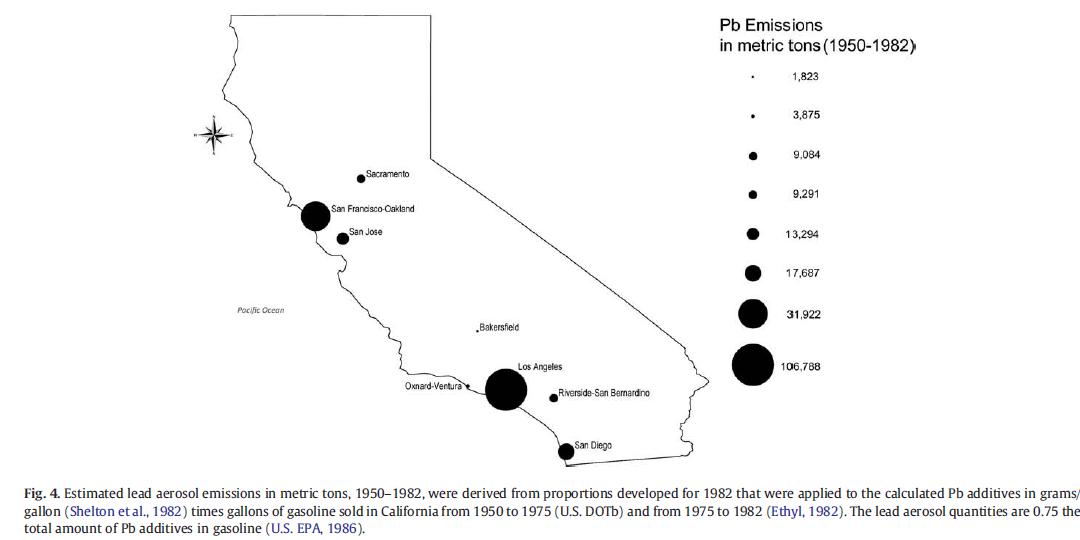
California Automotive Pb Emissions: 1950 to 1982
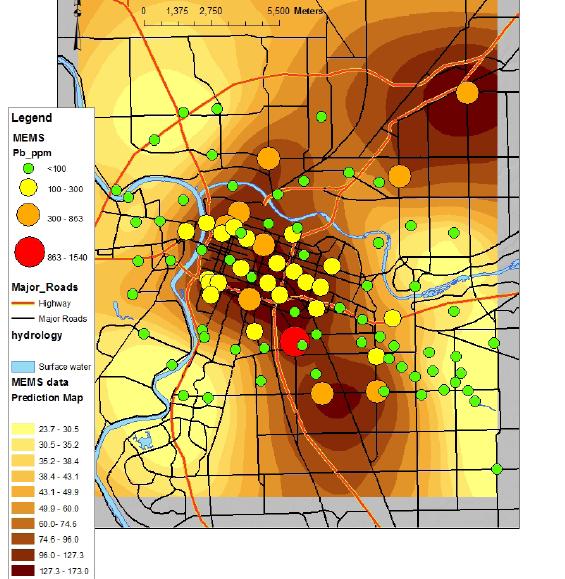
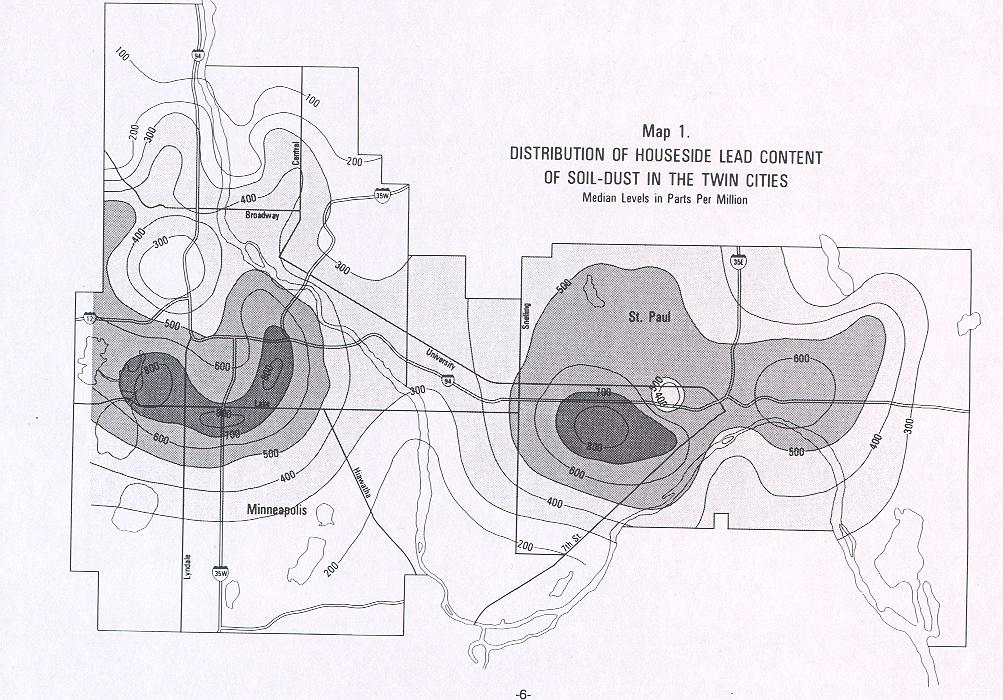
Minneapolis and St. Paul Minnesota(USA)
El Paso, Texas
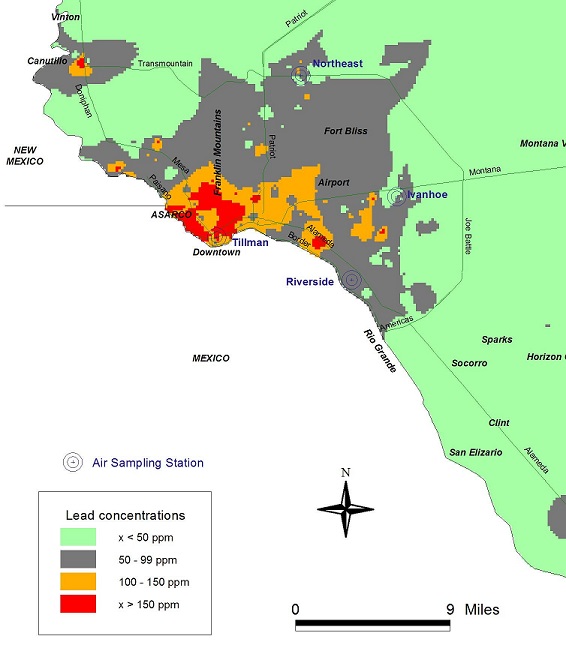
Source - SCERP Monograph Series no. 12, The U.S-Mexican Border Environment: Integrated Approach to Defining Particulate Matter Issues in the Paso del Norte Region.
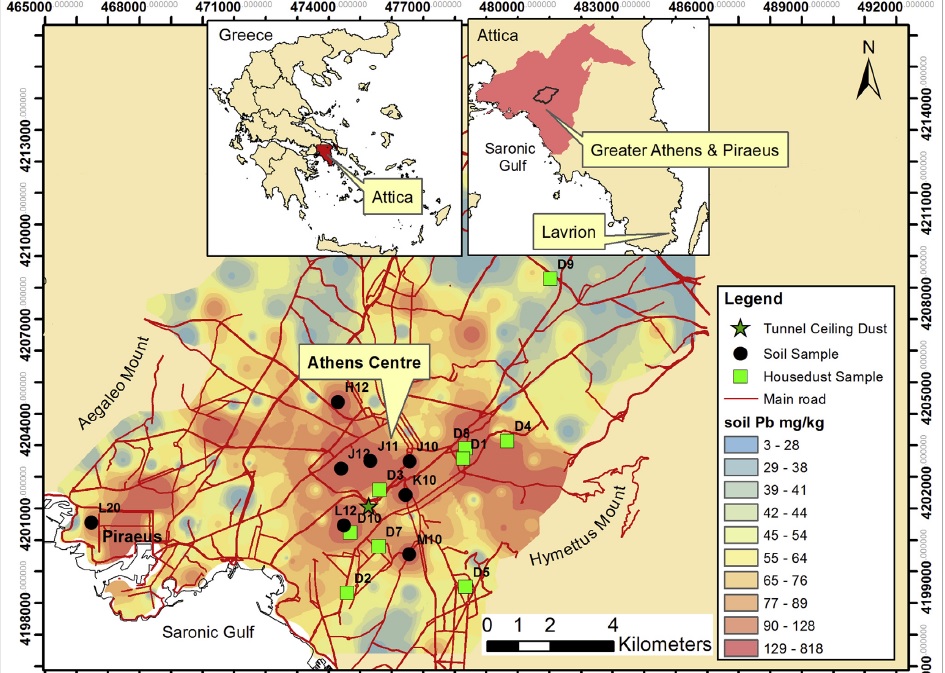
Athens, Greece
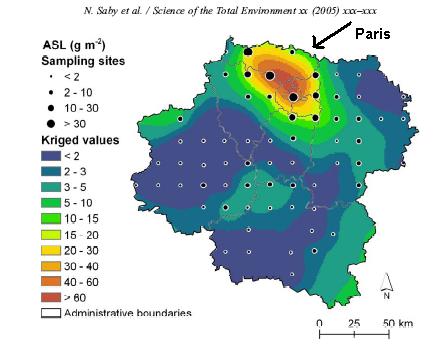
Paris, France
Great Britain
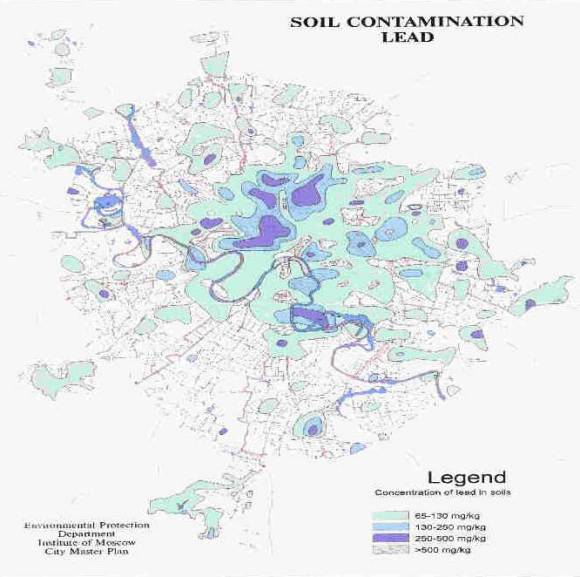
The British Geological survey systematically sampled Pb in the soils of 22 cities in Great Britain - Link.Moscow, Russia
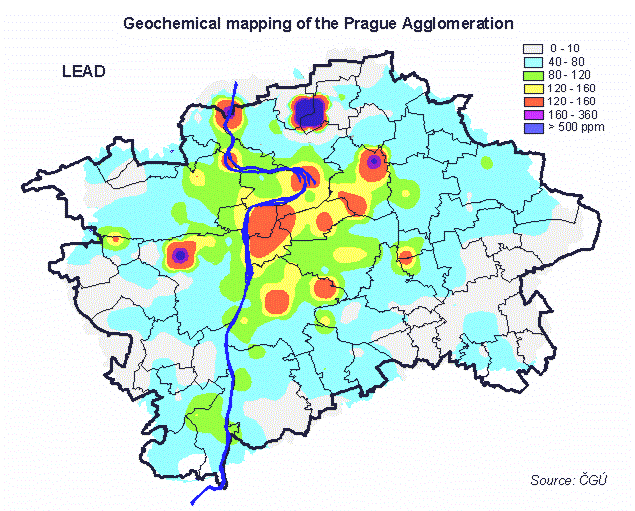
Prague, Czech Republic
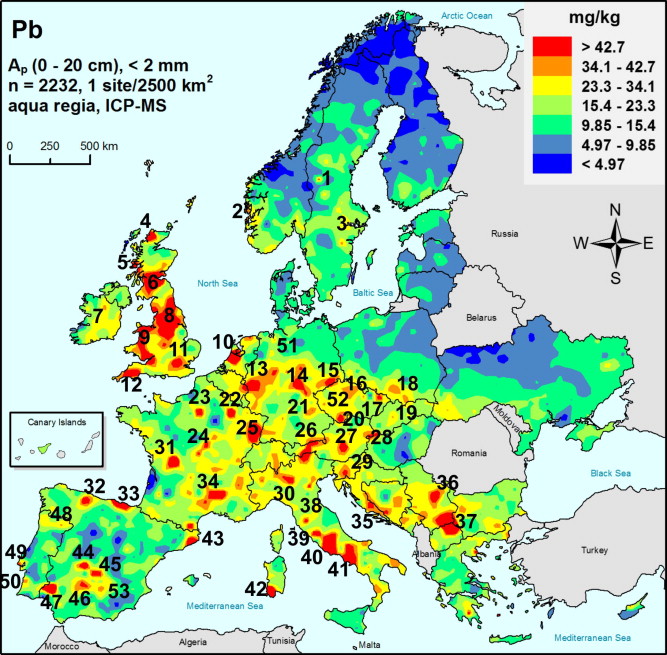
Europe
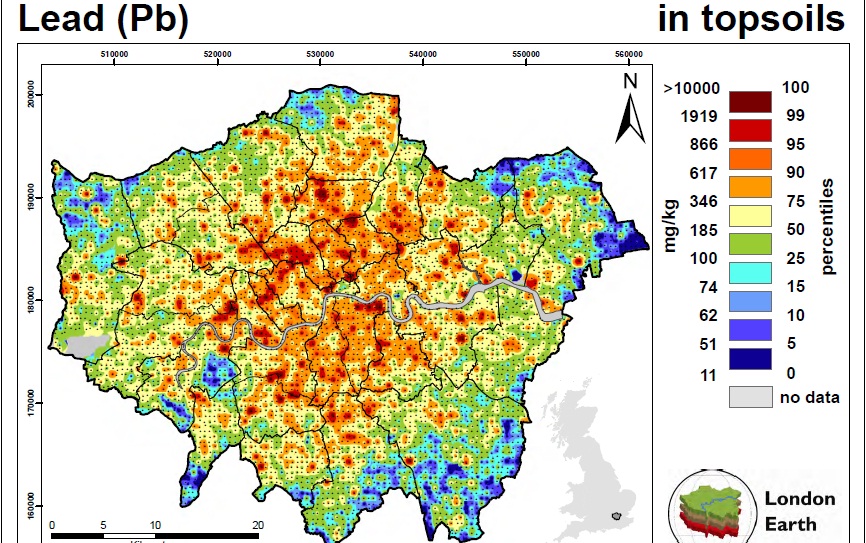
London, England
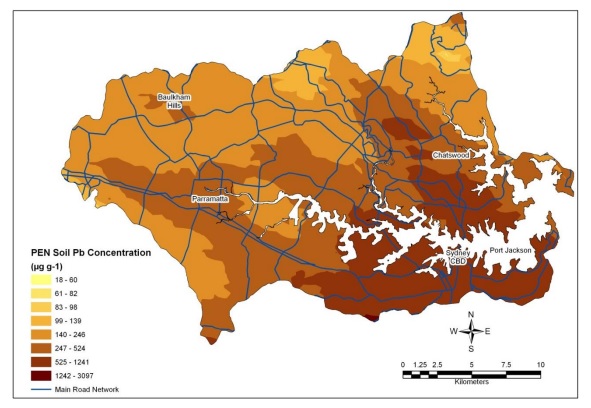
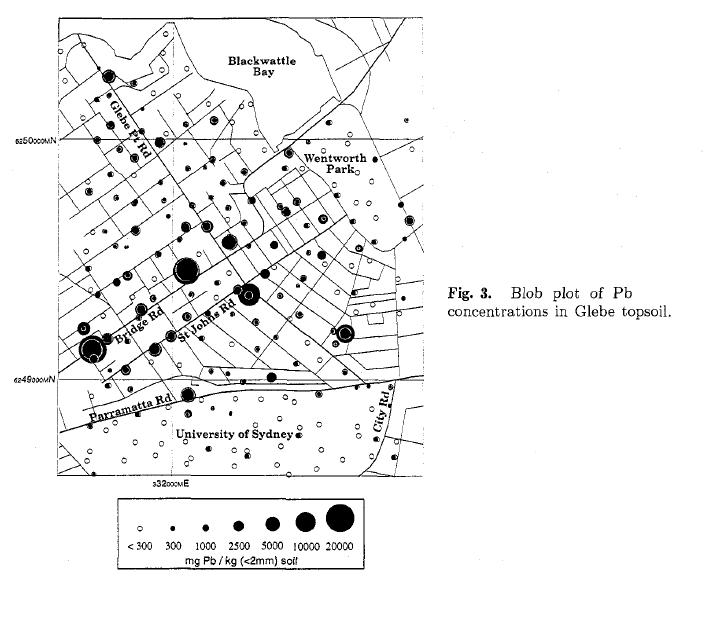
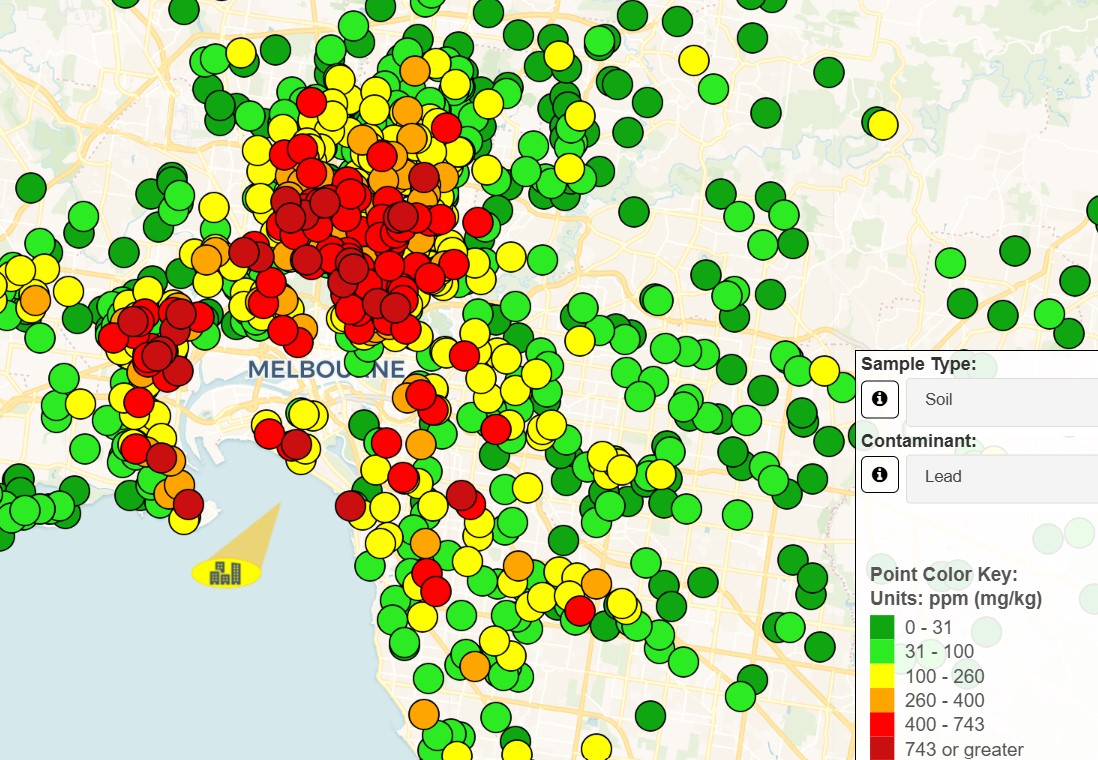
Sydney, Australia
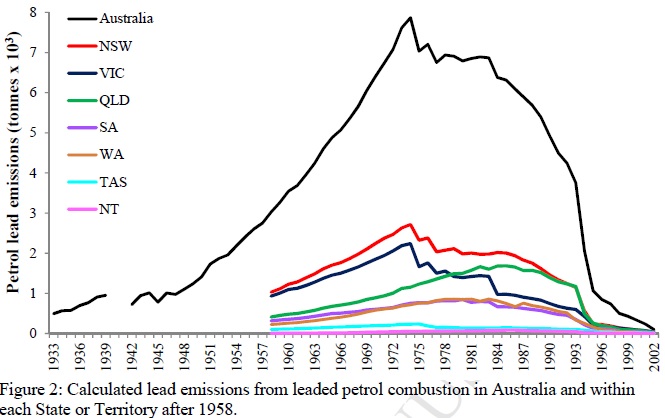
Lead emitted from gasoline (petrol) in high traffic Australian inner city areas between the 1930's and 2002.
Melbourne, Australia
Christchurch, New Zealand
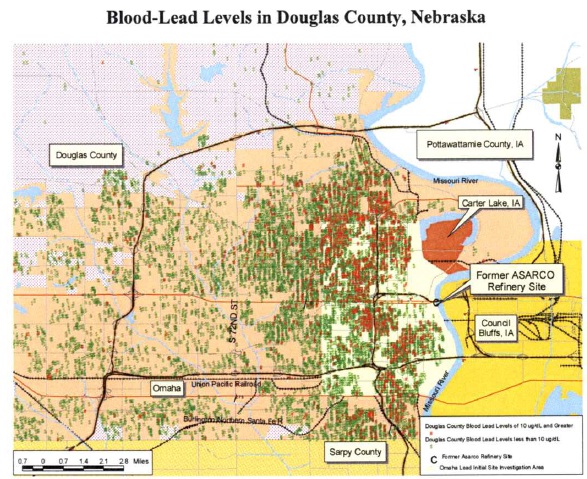
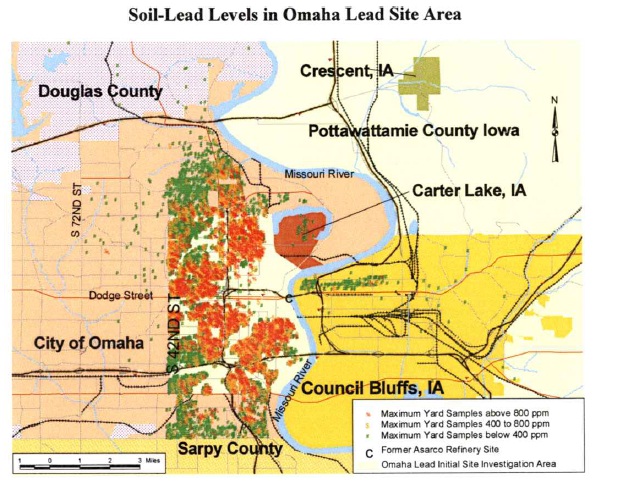
Omaha, Nebraska
Blood Lead Incidence Maps
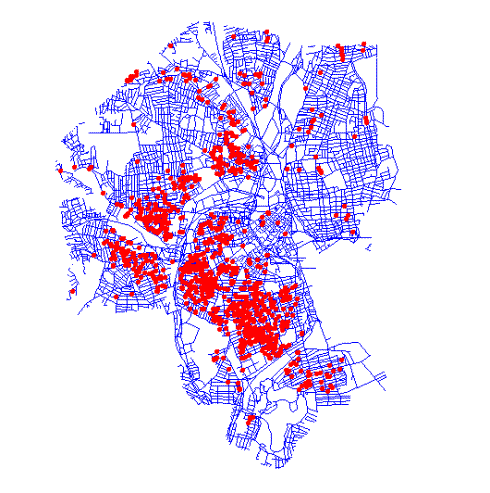
Chicago, Illinois
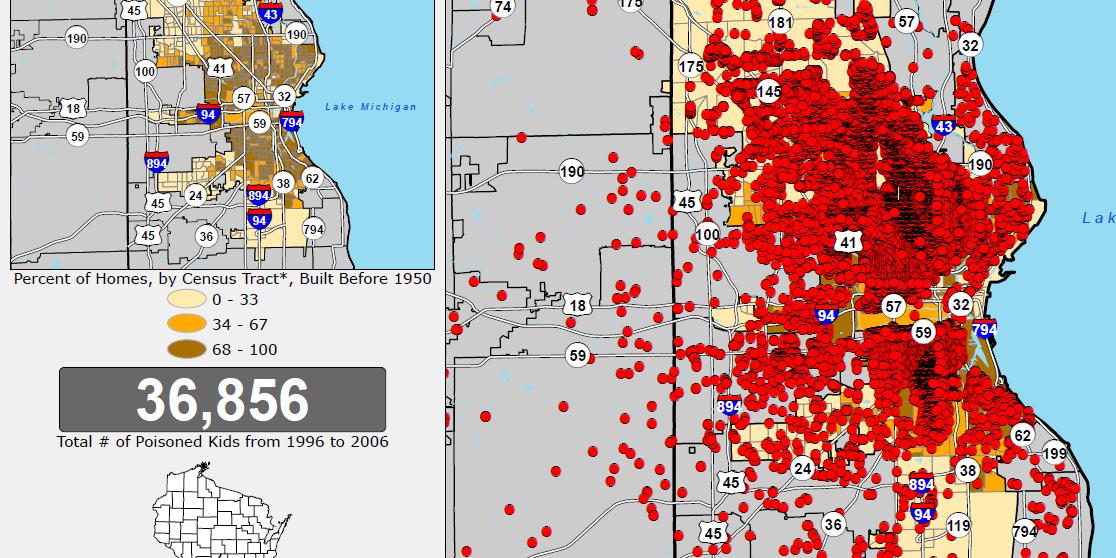
Milwaukee, Wisconsin
Providence, Rhode Island
Grand Rapids, Michigan
Louisville, Kentucky
Note the blood lead in areas built after 1950 when most of lead was eliminated from paint.
Blood Lead Prevalence in USA - (somewhat dated)
In many urban inner-city areas of the United States, there is an epidemic of childhood blood lead poisoning (Gould, 2009). It has been estimated that 24.5%, or 9.6 million U.S. children have a blood lead in the range of 2 to 10 micrograms per decilitre, a level which will cause sub-clinical signs (Gould, 2009). The National Health and Nutrition Examination Survey (NHANES) III 1999-2002 database indicates that approximately 2.4 million children have blood Pb levels between 5 and 9.9 microgram/deciliter (Iqbal et al., 2008) and that within that population of 1-'5-year olds with blood Pb levels of 5 microgram/deciliter or higher, the prevalence was 47% for non-Hispanic Black children, 28% for Mexican American children, and 19% for non-Hispanic White children (Bernard and McGeehin, 2003). The fact that children of color are nearly 4 times more likely than white children to have blood Pb levels between 5 and 10 microgram/deciliter (and 13 times more likely to have blood Pb levels above 20 microgram/deciliter) (Bernard and McGeehin, 2003) raises concerns about social justice and the long-term health of these children. In addition, in 2004, in 10 ABLES states, a total of 10,527 females aged 16--44 years were tested, and all BLLs for this group were reported. Of the number tested, 1,370 (13.0%) had BLLs >5 g/dL (10.9 per 100,000 female residents aged 16--44 years). I have not located the breakdown by race or by urban versus suburban area yet.
Soil Lead Blood Lead Dose-Response:All Examples
Dose-Response-USEPA IEUBK Model
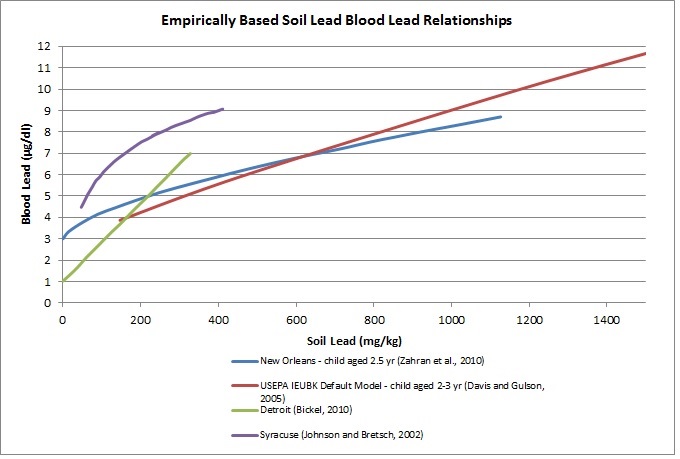
Dose Response - Empirical Relationships
Note that the empirical relationship between soil lead and blood lead observed in New Orleans (below) and Detroit (below) displays steeper slopes than the USEPA IEUBK model (above). This could possibly suggest that IEUBK model is under-predicting blood lead levels at lower concentrations.
New Orleans - Soil Lead Blood lead - Empirical Relationship
Dose-Response - Detroit
Lanphear et al. (1998): increasing soil lead concentration from background to 400 micrograms/g was estimated to produce an increase of 11.6% in the percentage of children estimated to have a blood lead level exceeding 10 micrograms/dL.
Malcoe et al. (2002): Logistic regression of yard soil lead >165.3 mg/kg (OR, 4.1; CI, 1.3-12.4) were independently associated with BPbs greater than or equal to 10 microg/dL.
Texas Dept. of Health (2004): Using large database from El Paso Area, study found an odds ratio 4.5 (1.4, 14.2)for the relationship between a 500 ppm increase in soil lead and blood lead level > 10 ug/dl.
Maisonette (1997): yard soil remediation showed the strongest association with changes in blood lead levels. This variable was found to be a protective factor for elevated blood lead levels in children (odds ratio, 0.28; confidence interval, 0.08-0.92).
In cases of chronic exposure lead often sequesters in the highest concentrations first in the bones/teeth, then in the kidneys.
Lead Concentrations In Bones/teeth Increase With Age
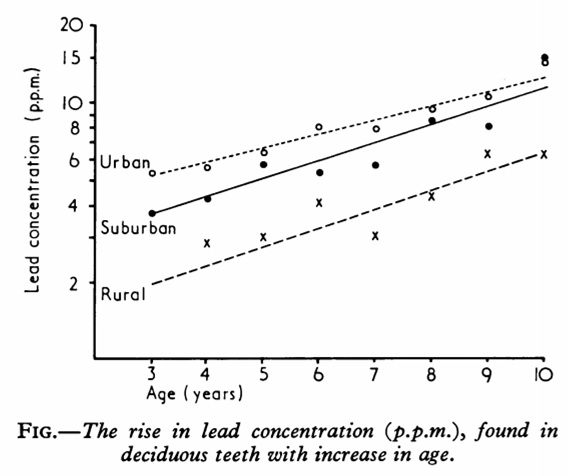
Link to Source
Priest and Frank (1990) reviewed the literature regarding lead in bones and teeth. Priest and Frank (1990) indicated that modern skeletal levels have been claimed to be 1000 times greater those determined in ancient Peruvian skeletons. The levels of lead in bones has been observed to be highest in inner city residents compared to suburban and rural residents. In addition, a linear increase in the logarithm of the bone lead concentration was found with age (r=0.9). At ages 3 to 4, the mean bone lead concentration for urban specimens was 5.55 ppm 4.05 ppm for suburban, and for rural as little as 1.9 ppm, whereas at ages 9 to 10, the means were 13.1, 10 and 6.3 respectively. Teeth in urban children contained five times as much lead as those of rural children. Another study showed urban tooth lead levels twice as high as suburban levels. These findings have been observed internationally. Thus it has been shown that children efficiently absorb lead which is stored in their bones.(Source - Priest, Nicholas D. , and Van de Vyver Frank. 1990. Trace Metals and Fluoride in Bones and Teeth. CRC Press, 400 p).
Lead Stored in Women's Bones Is Episodically Released During Pregnancy Exposing Fetus and Mother to Lead
Google Scholar Search of topic
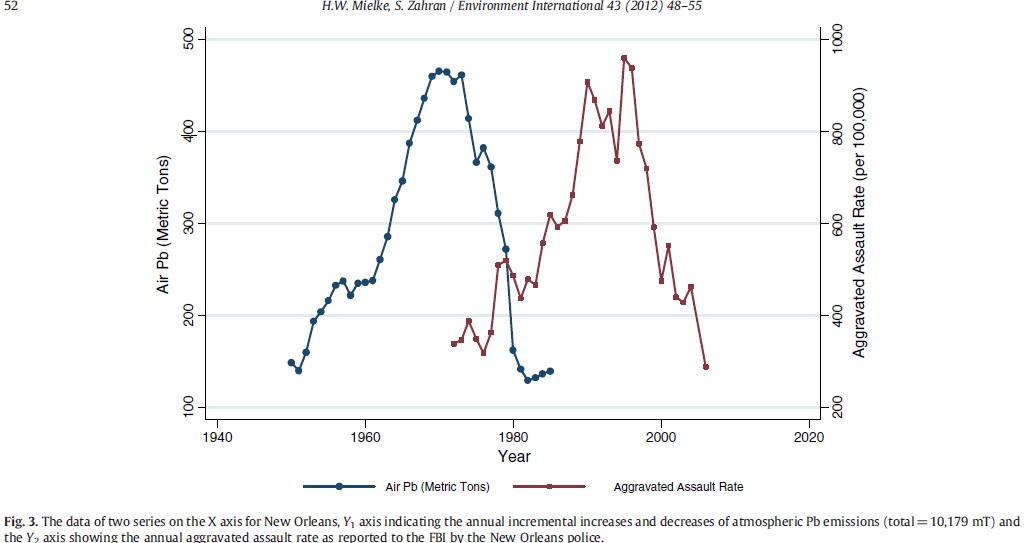
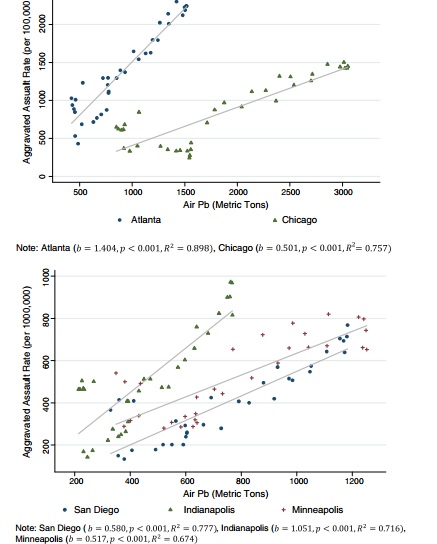
2012 Association Between Aggravated Assault and Air Pb - Six City Study - United States
2016 Association Between Aggravated Assault and Air Pb - Australia
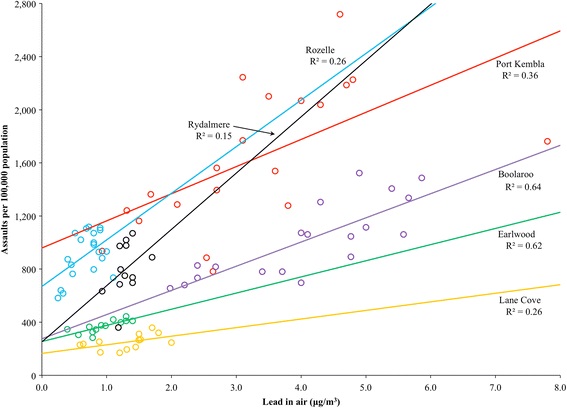
Link to Source - Taylor et al. (2016)
IF it is assumed that there is causality between lead exposure and violent attacks, what does that say about the culpability of those who were placed in prisons as a result of the lead peak, as well as those inprisoned due to violence in the inner cities? I do not know the answer.
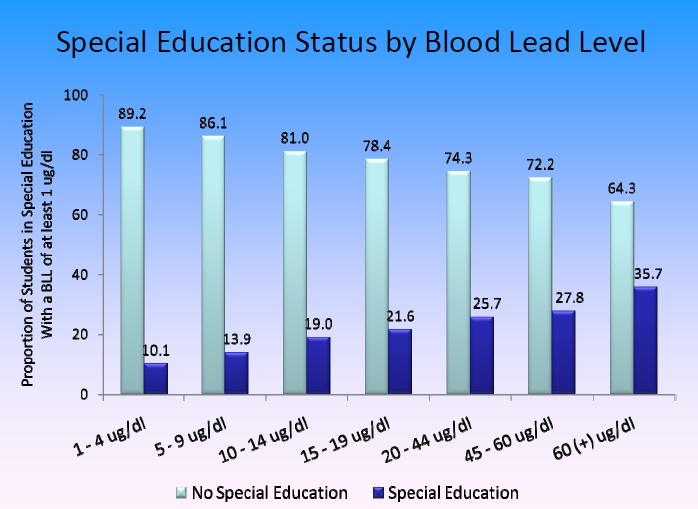
Various Health Outcomes at Low Blood Lead Levels (<10 ug/dL)
Low PbB levels (<10 ug/dL) typically associated with urban soil Pb exposure are associated with a myriad of health outcomes. Low PbB levels (<10 ug/dL) are associated with Attention-Deficit Hyperactivity Disorder (ADHD)(Nigg et al., 2010), a reduction in childrens tests scores for reading (odds ratio = 0.51, p = 0.006) (Chandramouli et al., 2009), writing (odds ratio = 0.49, p = 0.003) (Chandramouli et al., 2009; Miranda et al., 2007) and mathematics (Miranda et al., 2007). Canfield et al. (2003) observed that when lifetime average PbB concentrations in children increased from 1 to 10 mg/dL, the intelligence quotient (IQ) declined by 7.4 points. Jusko et al. (2008) observed that compared with children who had lifetime average PbB concentrations < 5 mg/ dL, children with lifetime average concentrations between 5 and 9.9 mg/dL scored 4.9 points lower on Full-Scale IQ (91.3 vs. 86.4, p = 0.03). Similarly, Surkan et al. (2007) observed that children with 5-10 mg/dL had 5.0 (S.D. 2.3) points lower IQ scores compared to children with PbB levels of 1-2 mg/dL (p = 0.03). Interestingly, multiple studies have shown that that the strongest Pb effects on IQ occurred within the the first few micrograms of PbB (Schnaas et al., 2006; Canfield et al., 2003; Lanphear et al., 2005). Low PbB levels (<10 ug/dL) have also been associated with various physiological outcomes such as kidney damage (Fadrowski et al., 2010), dental caries (Moss et al., 1999), puberty delay in boys (Williams et al., 2010) and girls (Selevan et al., 2003) and cardiovascular outcomes in adults (Navas-Acien et al., 2007).
Toxicity Below 10 ug/dl - CognitiveChiodo LM, Covington C, Sokol RJ, Hannigan JH, Jannise J, Ager J, Greenwald M, Delaney-Black V. 2007. Blood lead levels and specific attention effects in young children. Neurotoxicol Teratol. 2009_Miranda_Environmental_contributors_to_the_achievement_gap Lucchini, RG, S Zoni, S Guazzetti, E Bontempi, S Micheletti, K Broberg, G Parrinello and DR Smith. 2012. Inverse association of intellectual function with very low blood lead but not with manganese exposure in Italian adolescents. Environmental Research http://dx.doi.org/10.1016/j.envres.2012.08.003. |
Toxicity Below 10 ug/dl - Mortality |
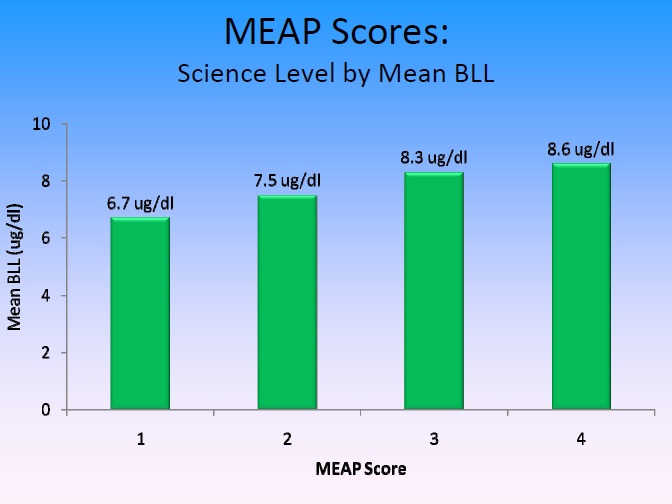
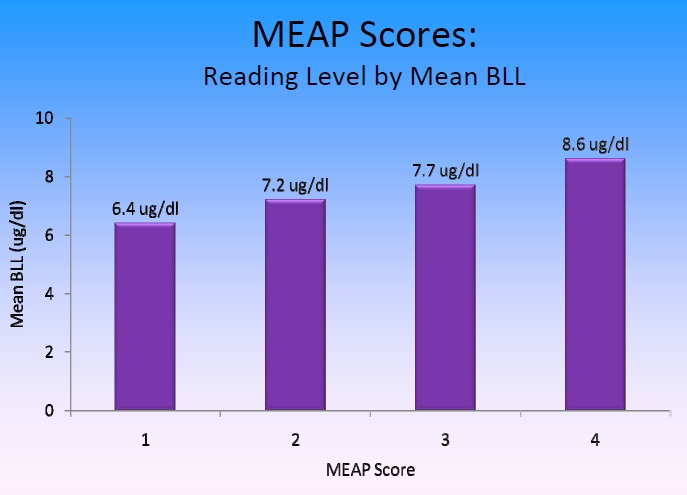
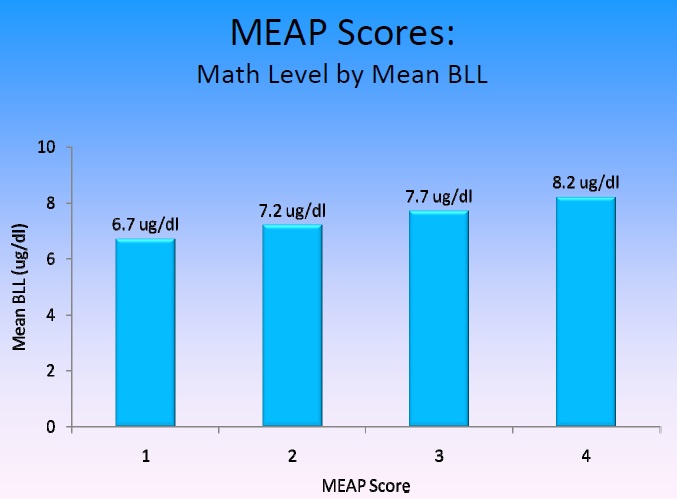
Detroit Blood Lead and School Outcomes
Solutions to the Problem: Review of the Soil Lead Remediation Literature
|
Link to - Laidlaw MA, Filippelli GM, Brown S, Paz-Ferreiro J, Reichman SM, Netherway P, Truskewycz A, Ball AS, Mielke HW. Case studies and evidence-based approaches to addressing urban soil lead contamination. Applied Geochemistry. 2017 Aug 1;83:14-30.
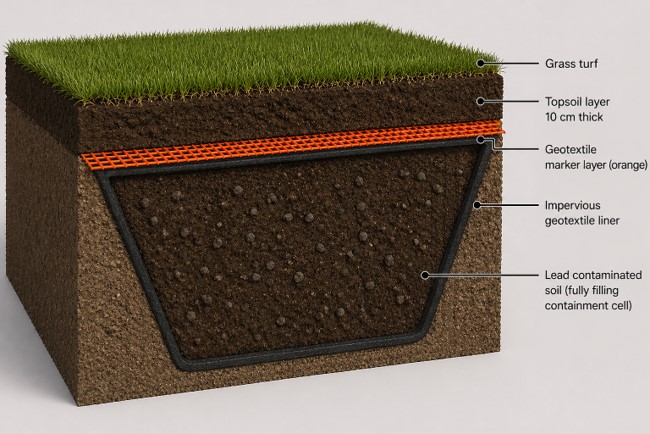
I have an untested hypothesis that blood lead reductions following various soil lead remediation efforts would be greater if it were not for the contributions of lead in the bones to blood lead levels. This was observed by Gwaizda et al. (2004) in "A Noninvasive Isotopic Approach to Estimate the Bone Lead Contribution to Blood in Children: Implications for Assessing the Efficacy of Lead Abatement" link to source "The soil emplacement was conducted by first spreading out a bright orange,
water pervious geotextile material to cover the original soil of the play area. The
geotextile layer prevents Pb-safe soil from mixing with the underlying original soil
and acts as a warning layer to anyone digging into soil. Soil was not removed from
the play areas in this project.
The Pb-safe soil was from the Bonnet Carr Spillway, located up-river from New
Orleans (U.S. ACE or Army Corps of Engineers). The alluvial soil, derived from the
sediments of the Mississippi River at the Bonnet Carr Spillway, has a median Pb content
of 5 mg/kg (Mielke et al., 2000). The Bonnet Carr soil was transported to the childcare
center and emplaced on top of the geotextile layer to a depth of at least 15cm(6 inches)."
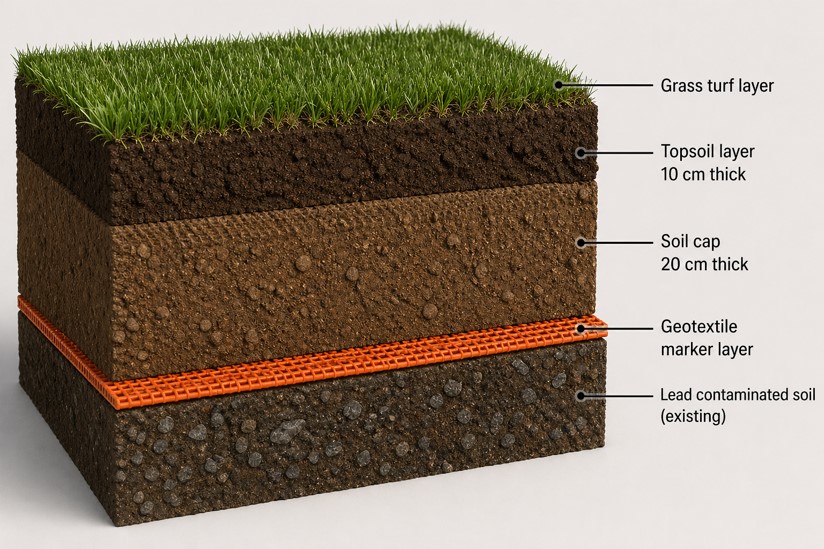
Lead-contaminated surface soils can be scraped off and placed into a stockpile, consolidated within an engineered containment cell constructed with a low-permeability base liner (and possibly the sides) , optional stabilization amendments added, a geotextile demarcation layer placed above the contaminated soil, and a minimum 0.5–1 m clean soil cap designed to minimize infiltration and prevent future disturbance, and the establishment of vegetative cover if possible. Signage indicating the presence of buried contaminated soil should be posted around the cell. Boston Pilot Program - Landscaping Mitigates Lead Poisoning Safe Yards: Improving Urban Health through Lead-Safe Yards (Litt et al., 2002)
Soil Lead Exposure Isolation Solutions - Graphics
Conceptual Model of Exposure to Exterior Lead in Urban Areas
Capping Method
Potential Solution – Home Rebuilds
Place lead contaminated soil below home structure and hardstand areas

Containment Cells
Excavate void, line w/ geotextile, scrape surface soil into cell, geotextile, topsoil, turf.
Potentially add lime/phosphate to cell
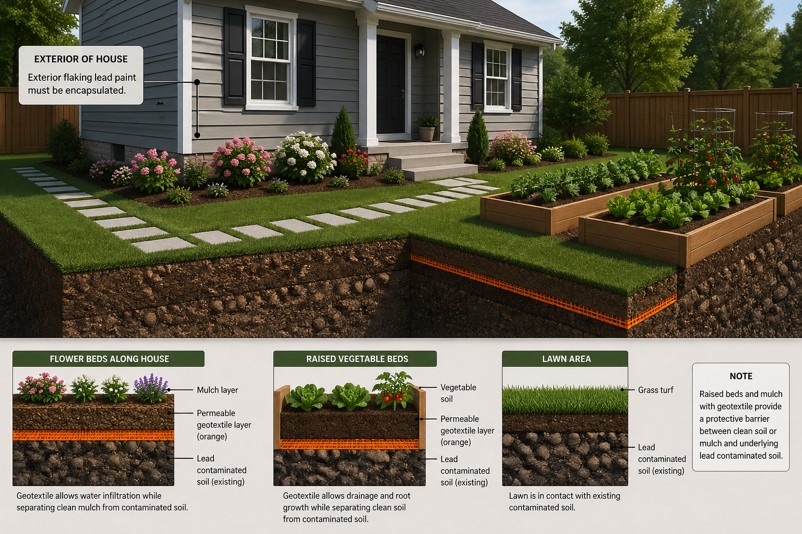
Flower Beds, Vegetable Gardens with Existing Diffuse Lead Contaminated Soil
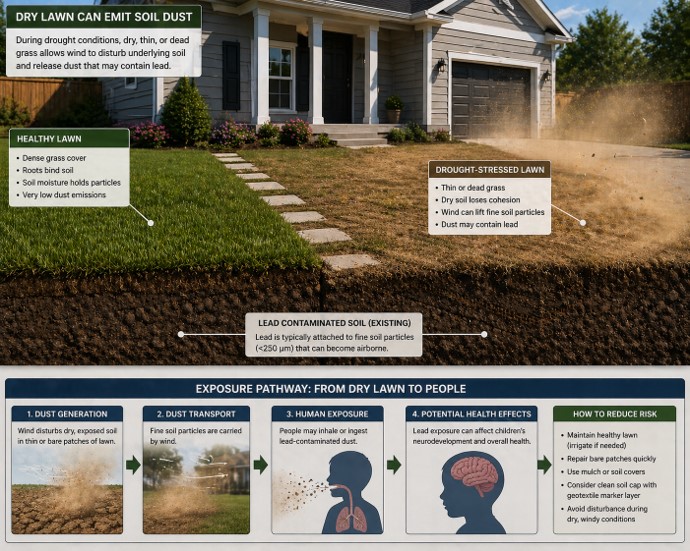
Soil Dust Emissions from Soil During Dry Conditions and Drought
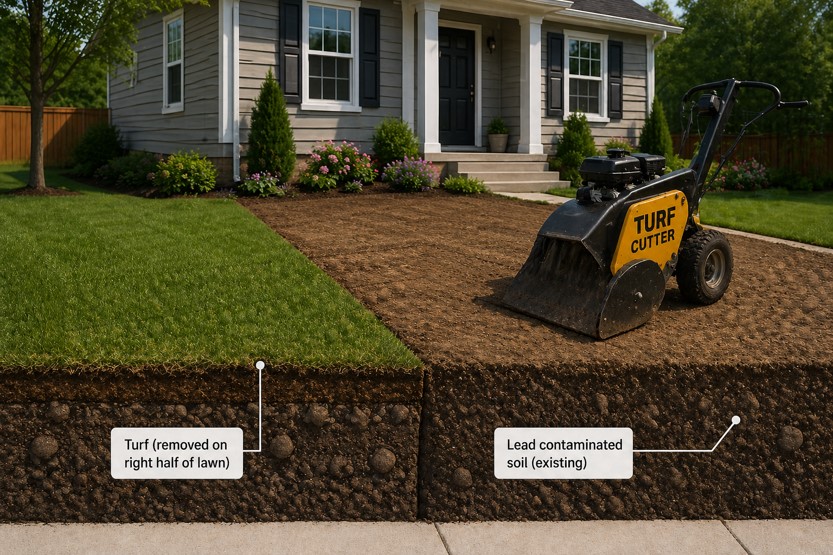
Turf Cutter Used to Remove Turf So Cap Can Be Placed on top of Lead Contaminated Soil
Solution - Remediation Precedent Set in New Orleans, Evansville and Omaha
Soil lead exposure reduction in the inner cities will improve health, increase students cognitive abilities and provide jobs, perhaps to inner-city residents.
Children in Tar Creek and Ottawa County, Oklahoma had historically been exposed to high levels of lead from former mining operations, especially around the Tar Creek Superfund site. In 1997, 21.5 percent of children living near Tar Creek showed elevated blood levels, defined as readings above 10 g/dl (micrograms per deciliter). For the same year, 12.61 percent of children in Ottawa Co., OK, showed elevated levels. Since then, through EPA, state, and tribal cleanup activities, lead-contaminated soil has been removed from 2,887 residential yards and public properties in the area. With additional funding from EPA, the Ottawa County Health Department has worked to increase community awareness about lead poisoning prevention and the importance of blood lead screening for children. These activities have achieved striking results, with 0 percent of area children showing elevated levels [>10 micrograms per decilitre] in 2013.
Simple Non-toxic Way Forward
Geotextile
Topsoil Slingers
Terraseeding (mix soil and grass seed)
Hydroseeding
Soil Treatment Strategy
I recommend that soil covering efforts first be conducted in areas where there is a high prevalence of lead poisoning and where soil lead levels are high (triage). I would first focus on roadside soils (0-25m) within these areas and then continue until areas with high lead poisoning prevalence are covered (or funds permit).
Estimated Cost of Urban Soil Lead Remediation - New Orleans
In the journal Environmental Science and Technology, Mielke et al. (2006) estimated the cost to remediate the soils in New Orleans. The abstract is presented below:
In New Orleans, LA prior to hurricane Katrina 20−30% of inner-city children had elevated blood Pb levels ≥10 μg/dL and 10 census tracts had a median surface soil level of Pb >1000 mg/kg (2.5 times the U.S. standard). This project tests the feasibility of transporting and grading contaminated properties (n = 25) with 15 cm (6 in.) of clean Mississippi River alluvium from the Bonnet Carr Spillway (BCS) (median soil Pb content 4.7 mg/kg; range 1.7−22.8). The initial median surface soil Pb was 1051 mg/kg (maximum 19 627). After 680 metric tons (750 tons) of clean soil cover was emplaced on 6424 m2 (69 153 ft2), the median surface soil Pb decreased to 6 mg/kg (range 3−18). Interior entrance wipe samples were collected at 10 homes before and after soil treatment and showed a decreasing trend of Pb (p value = 0.048) from a median of 52 μg/ft2 to a median of 36 μg/ft2 (25th and 75th percentiles are 22 and 142 μg/ft2 and 12 and 61 μg/ft2, respectively). Average direct costs for properties with homes were $3,377 ($1.95 per square foot), with a range of $1,910−7,020, vs $2,622 ($0.61 per square foot), with a range of $2,400−3,040 for vacant lots. Approximately 40% (86,000) of properties in New Orleans are in areas of >400 mg Pb/kg soil and estimated direct costs for treatment are between $225.5 and $290.4 million. Annual costs of Pb poisoning in New Orleans are estimated at ∼$76 million in health, education, and societal harm. Urban accumulation of Pb is an international problem; for example, the new Government of Norway established a policy precedence for an isolated soil cleanup program at daycare centers, school playgrounds, and parks to protect children. New Orleans requires a community-wide soil cleanup program because of the extent and quantity of accumulated soil Pb. The post-Katrina benefits of reducing soil Pb are expected to outweigh the foreseeable costs of Pb poisoning to children returning to New Orleans.
Estimated Benefit of National Urban Pb Paint and ?Soil? Lead Remediation - United States
Gould, 2009 estimated that the net benefit of lead hazard control ranges from $181 to $269 billion, resulting in a return of $17 to $221 for each dollar invested in lead hazard control. Note that the cost benefit by Gould did not include the cost benefit of reductions in autism, preeclampsia, schizophrenia, mental illness and many other diseases associated with lead poisoning. Thus the benefit of lead hazard reduction is likely to be much greater than Gould's estimates.
Recommended Funding Mechanism To Cleanup Urban Soils
Small Gasoline & Paint Tax!
Call For Blood Lead Incidence Data Transparency
I strongly suggest that the US government publish child blood lead incidence maps of the top 50 cities in the U.S by graphically displaying the location and all the blood lead concentrations (>5 ug/dl, > 10ug/dl and >20 ug/dl) for the previous 5 years, and updated yearly (see Detroit Blood Lead Incidence Map Above). The percentage of the children sampled should be boldly presented as well. These maps should be available for all to see on one central internet site. The website would be registered with all the major search engines so that anyone could locate the data. This data is already available and could easily be put together in a two month time period by someone experienced in GIS and the internet. The funding cost would be extremely small.
The public has a right to know.
Call For National Urban Soil Geochemical Risk Mapping Program
I suggest that the Obama administration use the United States Geological Survey to conduct an urban soil geochemical risk mapping program in the 50 largest cities in the United States. I recommend the geochemical mapping methods be adopted from the British Geological Survey, David L Johnson/colleagues at SUNY-ESF or Howard Mielke and colleagues at Tulane/Xavier. The results should be placed online in one central location for anyone to view.
There are three basic things that can be done:
1) Do nothing (this is what the current approach is);
2) Remediate (cover soils/remove or encapsulate flaking exterior lead-based paint & Pb water lines);
3) Move pregnant women and children away from source area.
History of Lead
Number of cases of elevated blood lead levels ≥10 micrograms per decilitre among children aged <5 years, by month in 2012 in the United States (source of data CDC, 2016)
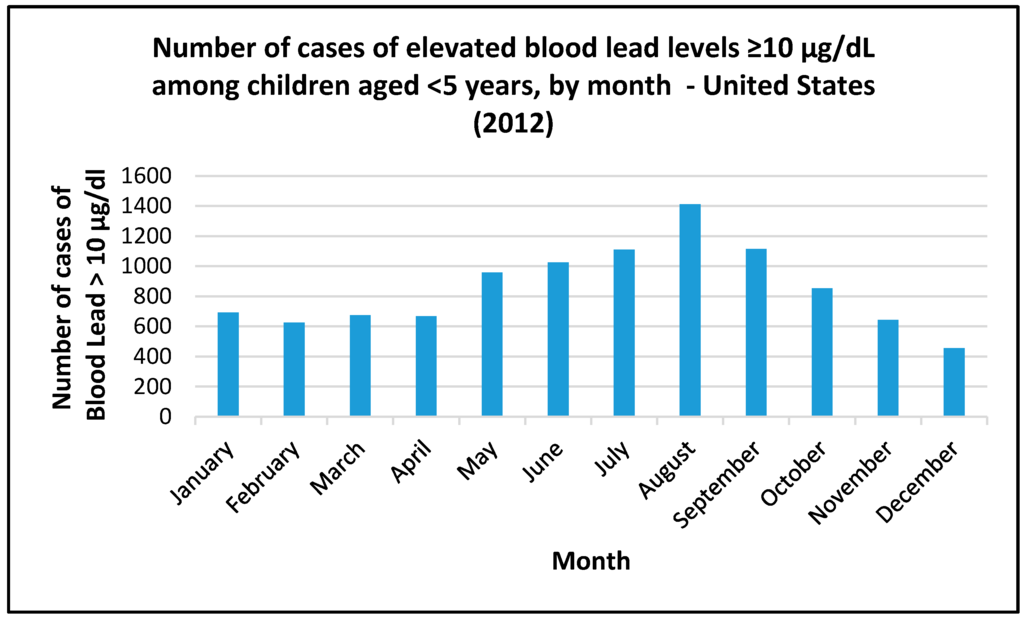
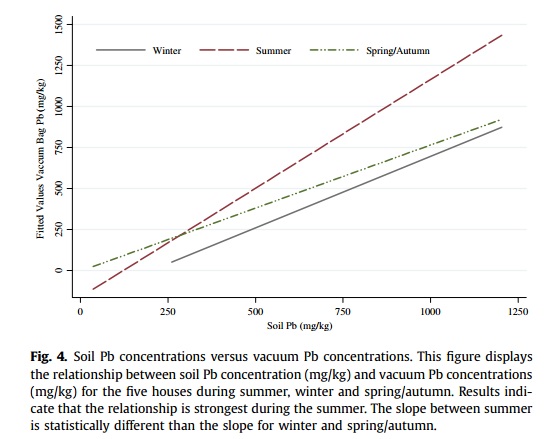
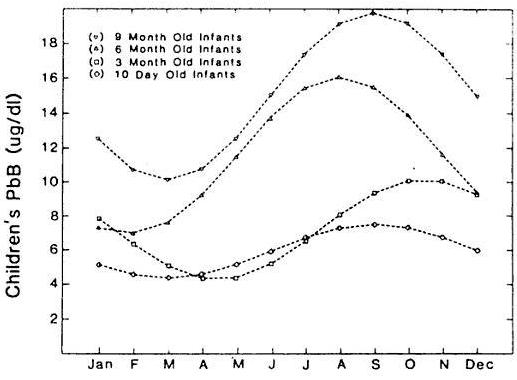
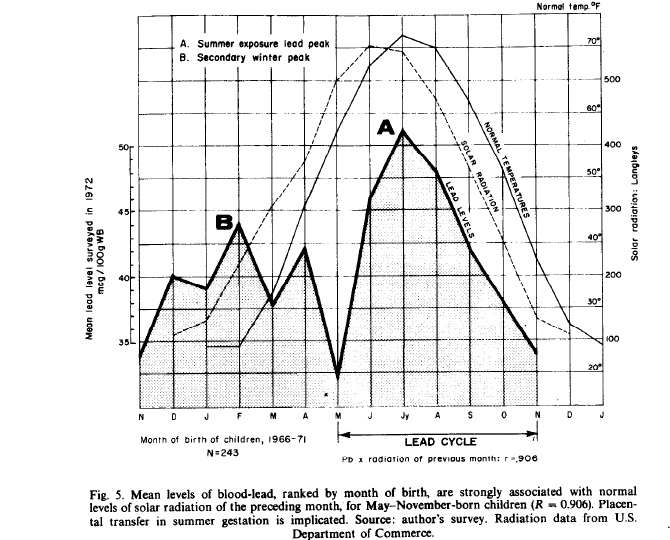
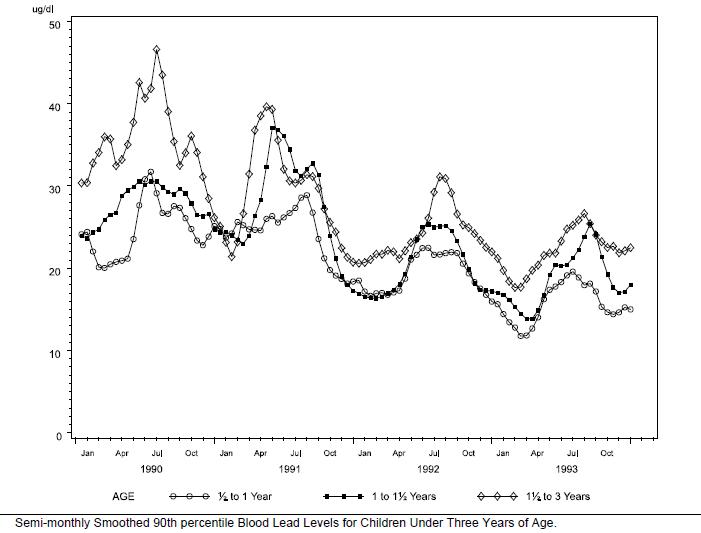
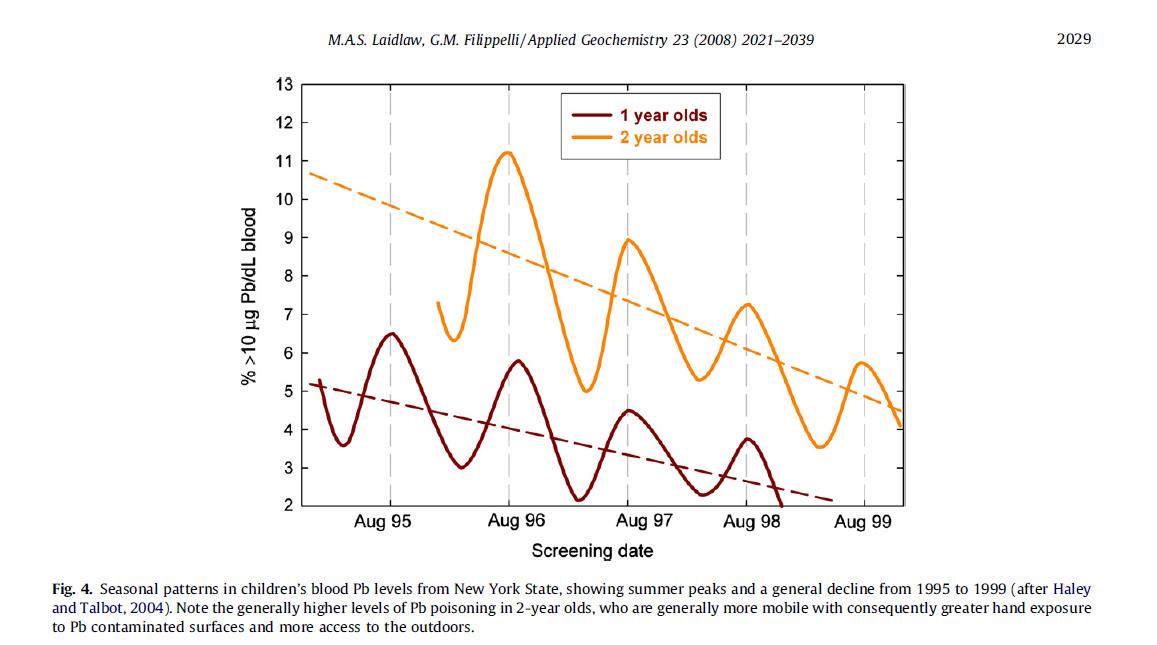
Children's Blood Lead Levels Also Display Strong Seasonal Variations With Peaks Generally in the Summer or Autumn When Soils Are Dry and Prone to Resuspension
A conceptual model of child BPb seasonal Pb poisoning is suggested. Lead from multiple sources has accumulated in soils of urban environments. The seasonal resuspension of Pb-contaminated soil in urban atmospheres appears to be controlled by soil moisture and climate fluctuations. This study (Laidlaw et al., 2005) indicates that higher urban atmospheric Pb loading rates are experienced during periods of low soil moisture and within areas of Pb-contaminated surface soils. Children and adults living in urban areas where surface soils are contaminated with Pb may become exposed through indoor and outdoor inhalation of Pb dust and ingestion of Pb deposited within homes and outdoor surfaces. Because resuspension of Pb from contaminated soil appears to be driving seasonal child BPb fluctuations, concomitantly, we suggest that Pb-contaminated soil in and of itself may be the primary driving mechanism of child BPb poisoning in the urban environment.
Soil Lead is a Major Source of Atmospheric Lead via Soil Re-suspension
This study also observed...
"Atmospheric soil and lead aerosols are 3.15 and 3.12 times higher, respectively, during weekdays than weekends and Federal Government holidays, suggesting that automotive traffic turbulence plays a significant role in re-suspension of contaminated roadside soils and dusts."
This was also observed by Resongles et al. (2021) in London (in the supplementary section).
I suggest that when the soil is resuspended, the fine fraction where the bulk of the petrol lead particles reside is suspended in the air. This fraction has a higher concentration than the bulk soil and also has a different isotopic signature (more anthropogenic) than the bulk soil. It is also suggested that air lead concentrations can result in very high concentrations at a height of two (m) in the summertime in cities where the soil lead concentrations are an order of magnitude higher than this Mexican city. It does not take much imagination to understand that air lead concentrations at two metres are at the same height as windows which likely results in air lead penetration into homes.
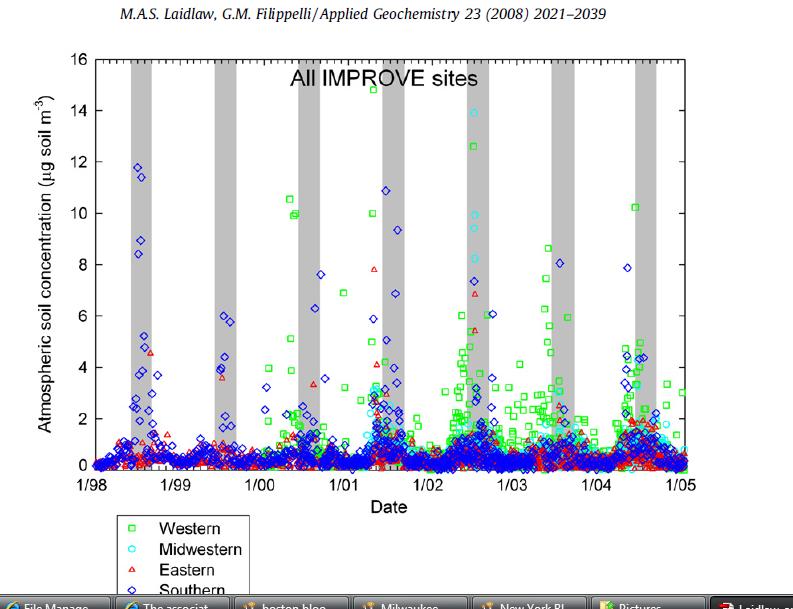
Atmospheric Soils Are Resuspended With Peak Concentrations in the Summer and Autumn in the U.S.
1.) Interagency Monitoring of Protected Visual Environments (IMPROVE): 1998 - 2005.
2.) Author:Nicholas E. Pingitore, Jr.1,2*, Juan W. Clague1, Maria A. Amaya2, Beata Maciejewska1, Jess J. Reynoso3
Title:Urban Airborne Lead: X-Ray Absorption Spectroscopy Establishes Soil as Dominant Source
Source: PLOS One Link
Despite the dramatic decrease in airborne lead over the past three
decades, there are calls for regulatory limits on this potent pediatric
neurotoxin lower even than the new (2008) US Environmental Protection
Agency standard. To achieve further decreases in airborne lead, what
sources would need to be decreased and what costs would ensue? Our aim
was to identify and, if possible, quantify the major species
(compounds) of lead in recent ambient airborne particulate matter
collected in El Paso, TX, USA.
Methodology/Principal Findings:
We used synchrotron-based XAFS (x-ray absorption fine structure) to
identify and quantify the major Pb species. XAFS provides
molecular-level structural information about a specific element in a
bulk sample. Pb-humate is the dominant form of lead in contemporary El
Paso air. Pb-humate is a stable, sorbed complex produced exclusively in
the humus fraction of Pb-contaminated soils; it also is the major lead
species in El Paso soils. Thus such soil must be the dominant source,
and its resuspension into the air, the transfer process, providing lead
particles to the local air.
Conclusions/Significance:
Current industrial and commercial activity apparently is not a major
source of airborne lead in El Paso, and presumably other locales that
have eliminated such traditional sources as leaded gasoline. Instead,
local contaminated soil, legacy of earlier anthropogenic Pb releases,
serves as a long-term reservoir that gradually leaks particulate lead
to the atmosphere. Given the difficulty and expense of large-scale soil
remediation or removal, fugitive soil likely constrains a lower limit
for airborne lead levels in many urban settings.
Urban Atmospheric Lead Is Associated with Particulate Matter Less Than 10 micron in Size (PM10)
Mexico City - 1991
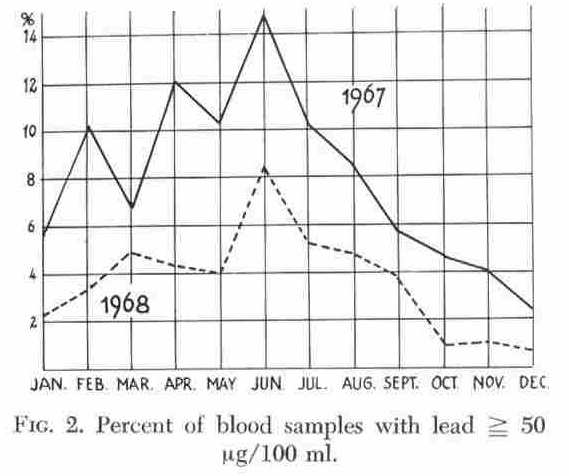
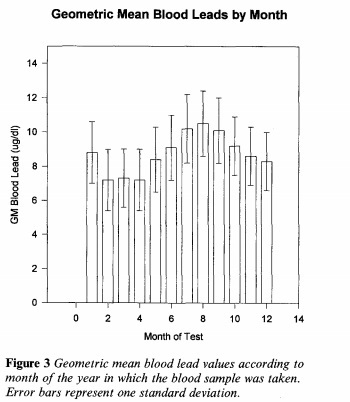
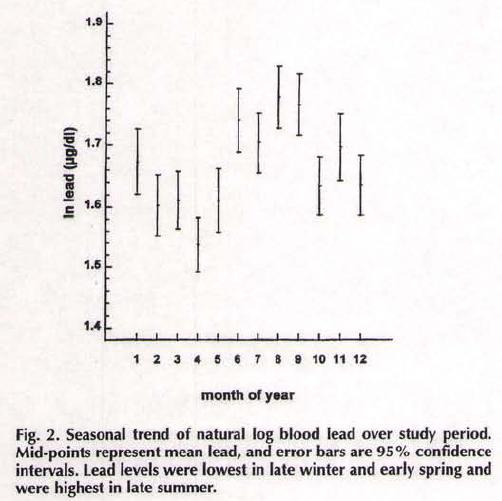
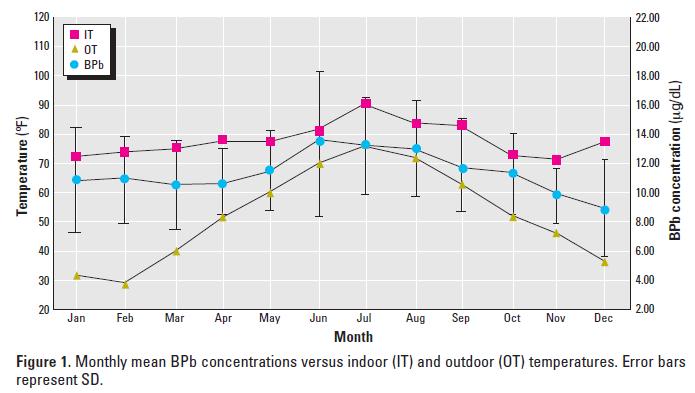
Blood Lead Seasonality
Note the blood lead seasonal patterns below. Whatever drives these seasonal blood lead changes is the major driving force of urban blood lead poisoning.
Unknown City
Chicago, Illinois
Syracuse, New York
Lansing, Michigan
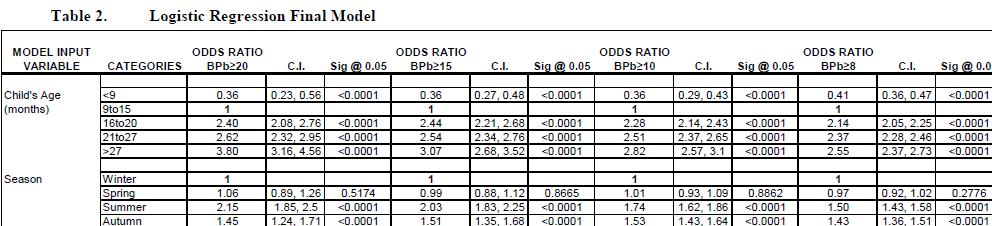
Children's Blood Lead Seasonality - State of Michigan: 1999-2012.
Milwaukee,Wisconsin (USA)-New
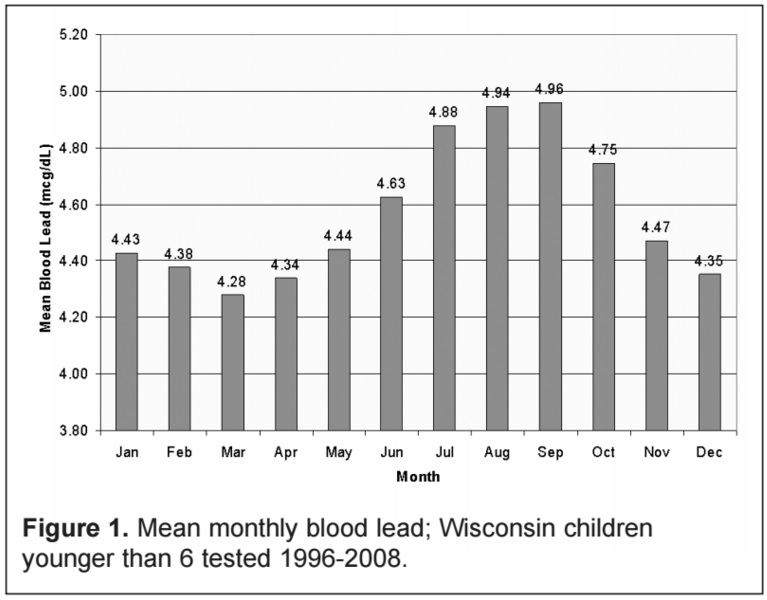
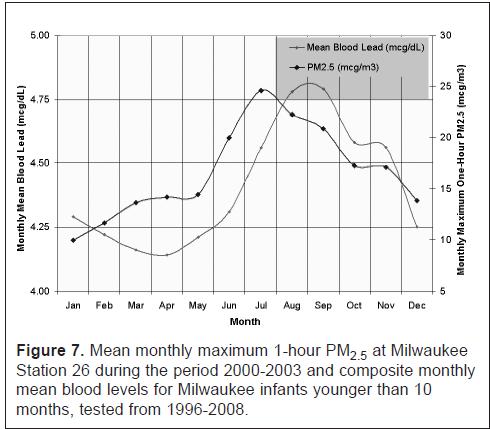
Milwaukee,Wisconsin (USA)-Old
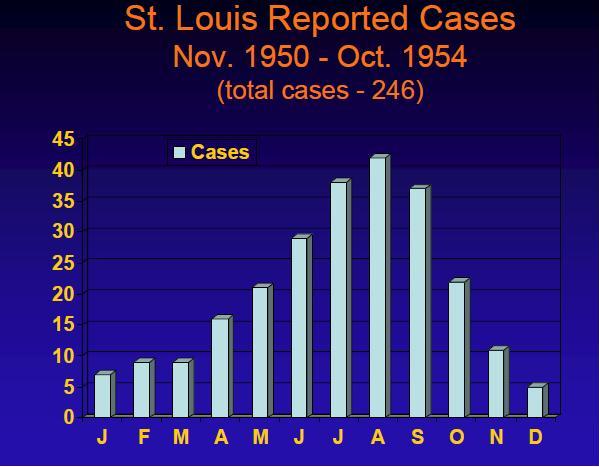
St. Louis,Missouri (USA)
Birmingham, England
Seasonality of Lead Loading in the Interior of a Northern England House
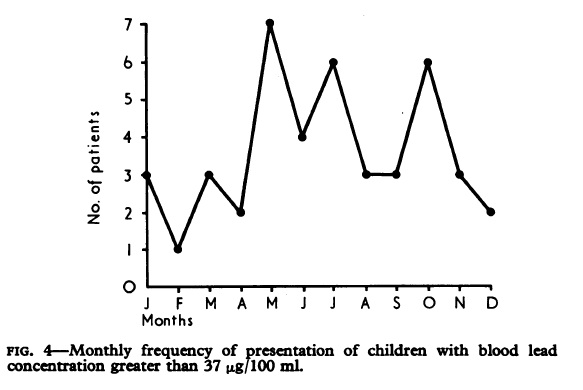
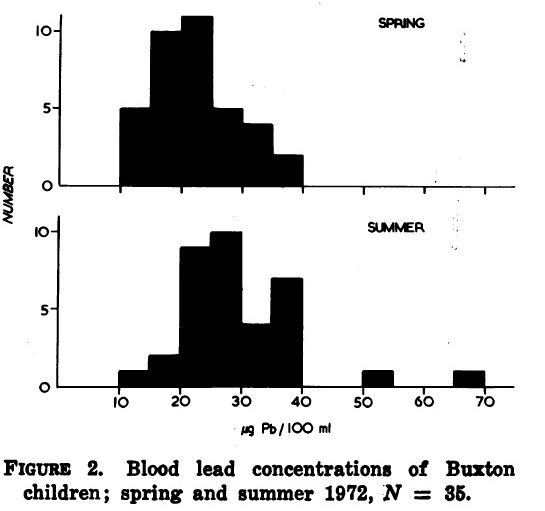
Blood Lead Seasonality in Buxton, England - 1972
Boston,Massachusetts (USA)
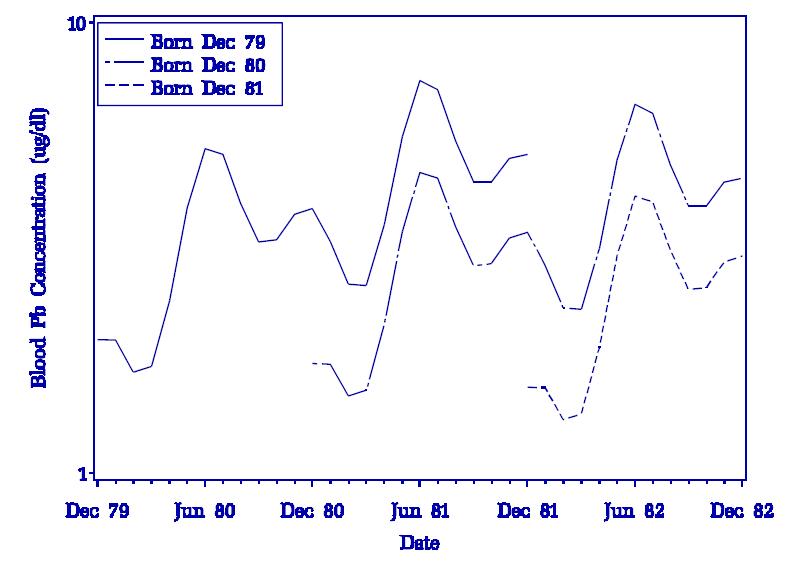
New York State, (USA)
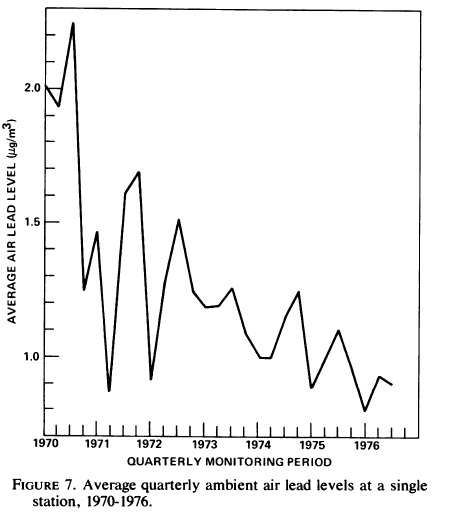
New York City Atmospheric Lead: 1970-1976
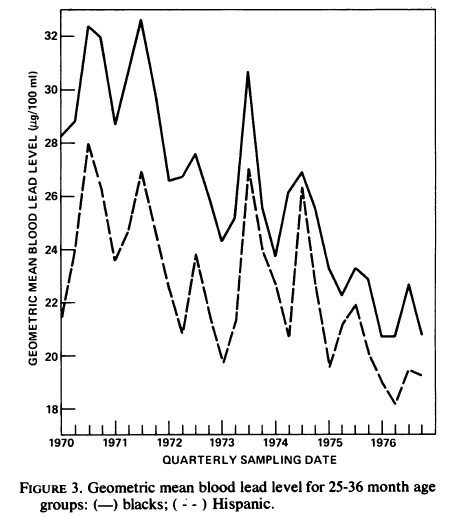
New York City Blood Lead Seasonality: 1970-1976
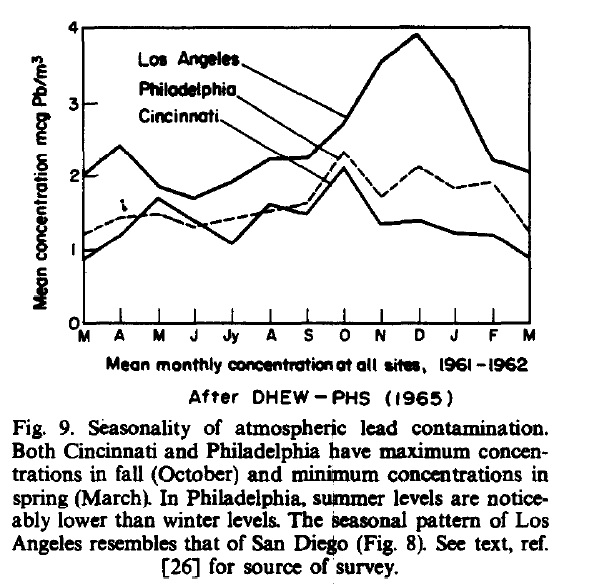
Los Angeles, Philadelphia and Cincinatti Atmospheric Lead Seasonality
Los Angeles, California (USA)
Jersey City, New Jersey (USA)
State of New Jersey - 2000 to 2004 (USA)
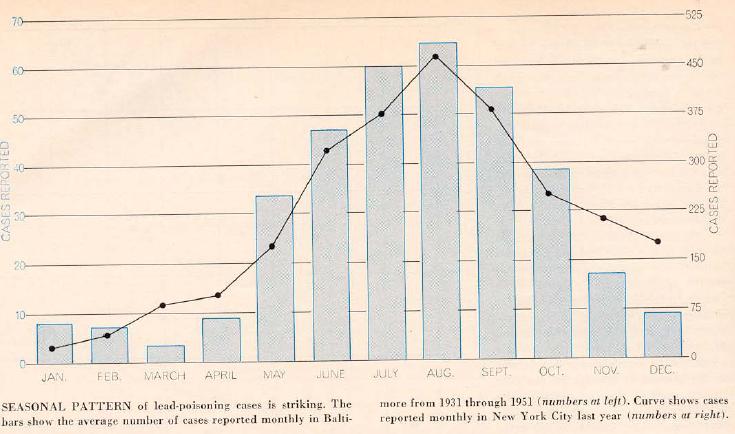
Baltimore, Maryland & New York City (USA)
Chicago, Illinois(USA)
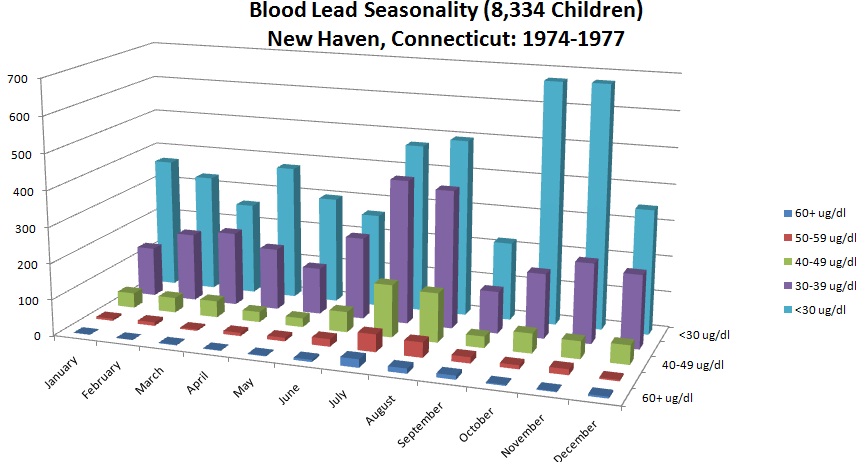
New Haven, Connecticut(USA)
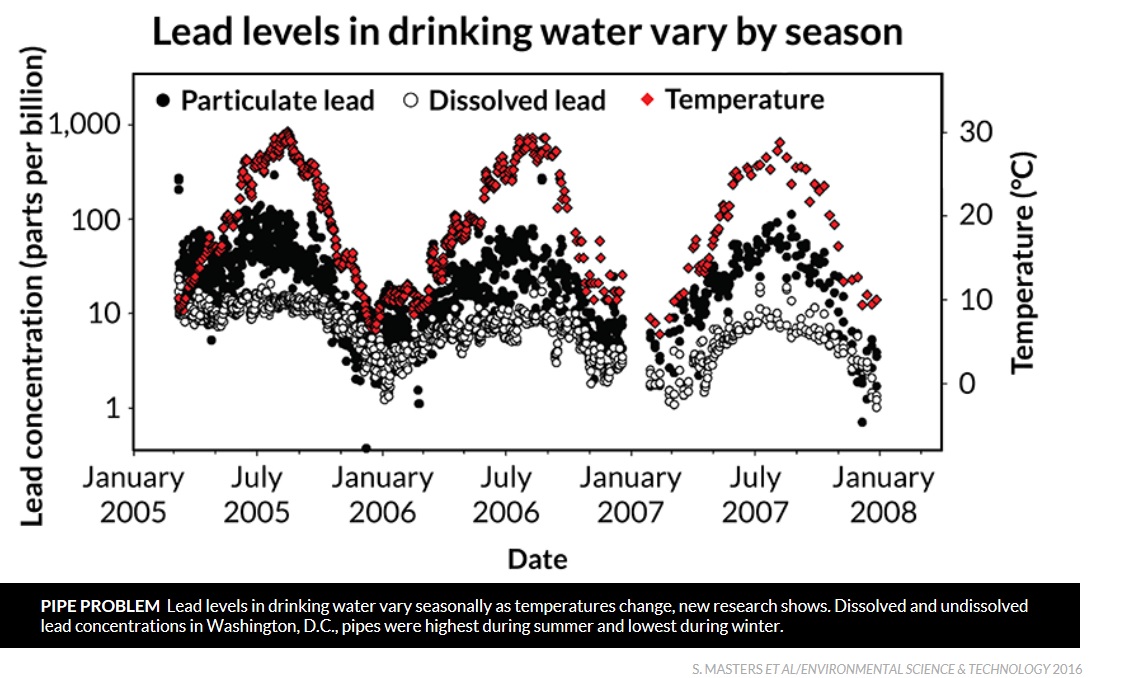
To make matters more complex, water lead levels also display seasonal variation - Washington DC
Montreal
UNTESTED Hypothesis for the declines in blood lead levels Following the elimination of lead in gasoline
I have questioned whether the decline if in blood levels following the elimination of lead in gasoline has resulted because in urban areas highly contaminated soils have been resuspended year after year. What could be happening is that a sizable percentage of the resuspended soil and lead falls on impervious surfaces such as roofs and roadways. This material could have then been brought out of the system depositing into sediments in rivers and estuaries. This could conceivably be reducing the lead concentrations in urban soils and subsequents exposures in the atmosphere through resuspension. The "signal" should be present in the sediments of estuaries. (indeed it is in Sydney, AUstralia - see Birch - University of Sydney). This is only a hypothesis at present.
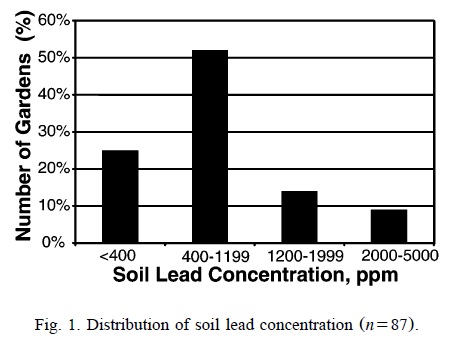
Homegrown Vegetables Are Another Exposure Pathway to Lead in Urban Soil
The recent movement towards cultivating homegrown vegetables, partly due to the global financial crisis, poses risks due to the uptake of lead in certain vegetables.
The following documents have been selected to educate the reader:
Garden Safe, Garden Well (Gabriel Filippelli, IUPUI)
2011 - Gardening and Lead Review Paper
Chicago Illinois Lead Uptake in Vegetables Study
Home Gardening in Lead Contaminated Soil
Gardening on Lead- and Arsenic-Contaminated Soils
Heavy metals contamination of home grown vegetables near metal smelters in NSW
Sustainable Gardening Information Page
Vegetable Consumption and Blood Lead Concentration
Eggs Laid in Urban Areas Can Be Contaminated with Lead
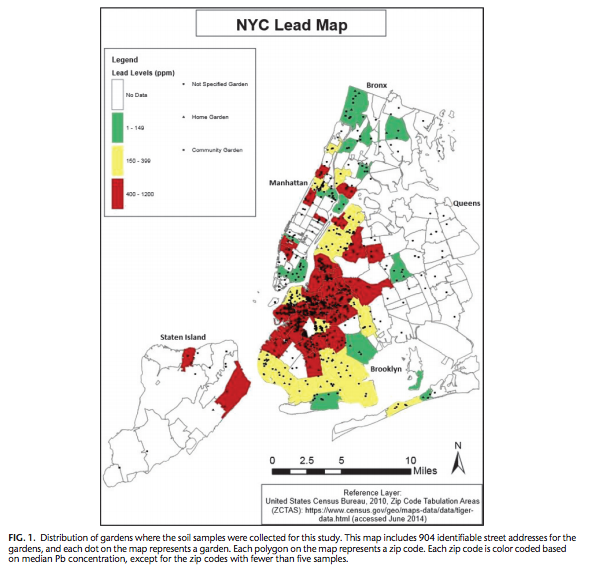
New York City - Garden Soil Lead (median concentrations)
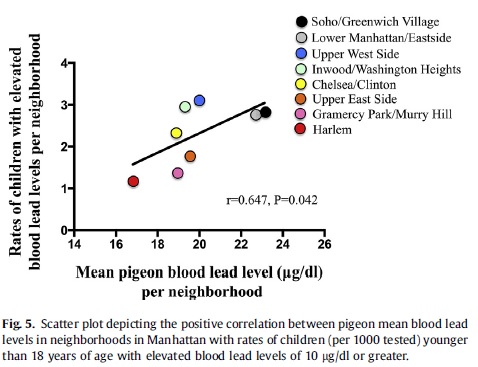
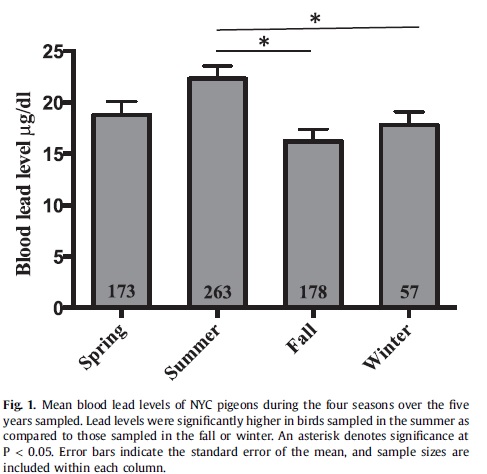
New York City - Association between Blood Lead in Pigeons and Children's Blood Lead Levels
Global Lead Production (million tonnes)

Lead is nefarious element - it is used in bombs and bullets in wars, bullets in crime and poisons hundreds of millions of children and adults worldwide through lead in soil, water, food and paint exposure. Lead also poisons very large numbers of wildlife due to the current and past use of lead shot and bullets.